
Feature your business, services, products, events & news. Submit Website.
Breaking Top Featured Content:
Ramp Capital: Everything Is Broken
Authored by Ramp Capital via The Ramp Report (subscribe here)
Everything is broken.
Crypto, stocks, bonds, housing, consumer confidence, inflation, the list of bad news seems never ending.
Let’s take a look at some of the best charts I came across this week and provide a little more color.
Fed Up:
Investors who’ve been around the block a few times know that corporate earnings and macroeconomic data drive the medium and long term trends of the stock market. Short term trends tend to be driven more by the combined psychological responses to these data points. And right now, the Street is finding it difficult to get any more bearish.

In 2010, fresh off the lows from the GFC, the biggest driver of the market seemed to always be centered around the monthly jobs report. It was the highest profile event that all investors paid the most attention to as they were using it as a gauge to determine when they thought the Great Recession was finally over.
Looking at the US Unemployment Rate since 1950, you can see how every spike in unemployment coincided with a recession and every peak marked the end of it. Unemployment hit a peak of 10.1% in October 2009 and subsequently declined all the way down to 3.5% for the next 10 years.
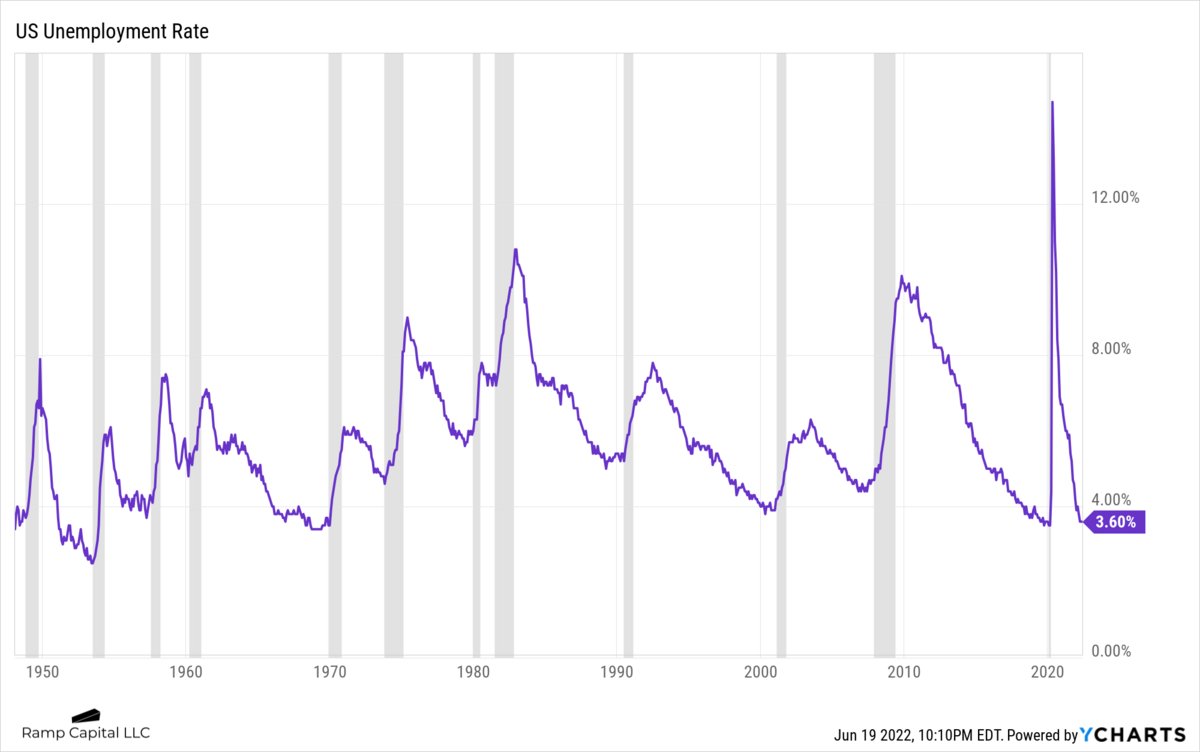
Because we’re in such a tight labor market and the unemployment levels have been in a steady decline since the GFC (sans the Covid spike), it feels like this economic data point just hasn’t had the same impact on markets that it had over the previous 10+ years. However, this could change based on how hawkish the Fed gets with regards to hiking rates to battle inflation.
It seems that it’s only when datasets get completely off trend and out of line that we become hyper-focused on what the data is trying to tell us. Especially, if we think it will impact collective sentiment and future earnings.
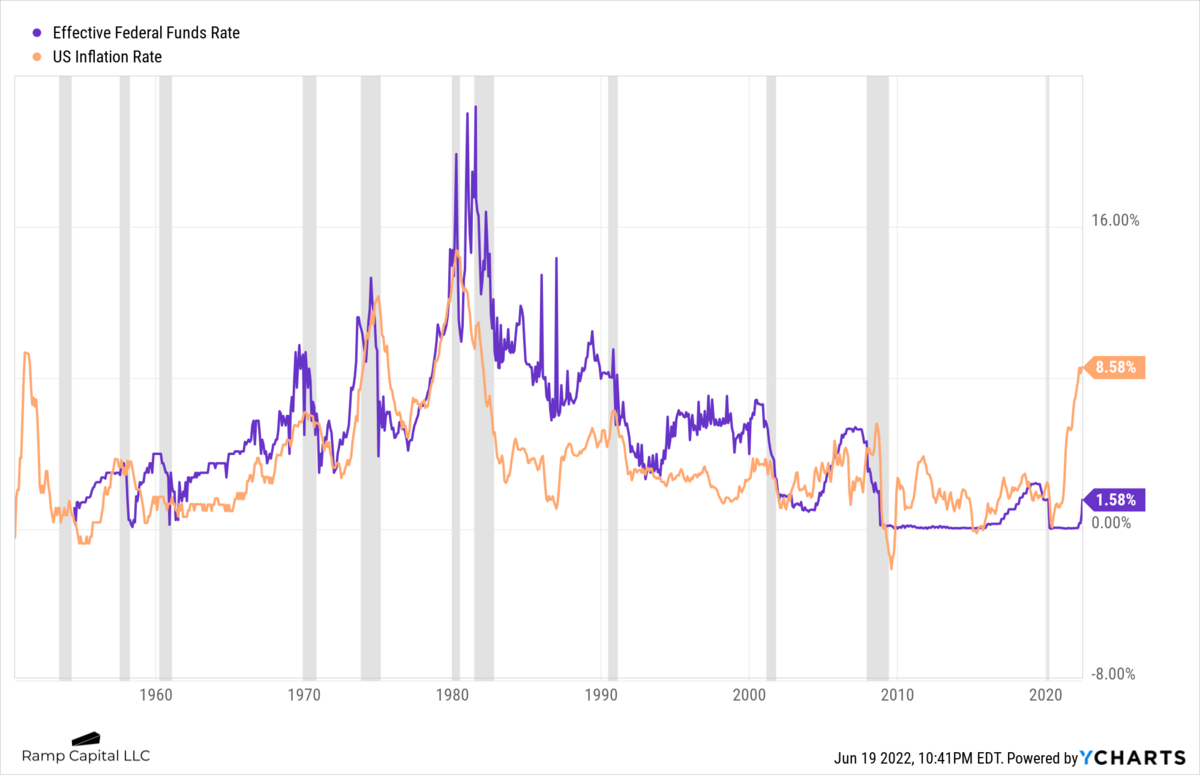
Inflation and the Federal Reserve’s policy to deal with it are the two main focal points during this current cycle. We didn’t really care much about inflation since the GFC because it was maintained in a 0 to 4% bound. Now that the genie is out of the bottle, we are dealing with a whole new set of problems.
On Wednesday last week, the FOMC increased the Federal Funds rate by 75bps, the largest hike since 1994. This was predicted by many Fed watch tools and traders after last week’s inflation data came out hotter than expected, again, and the information of a potential 75 bps hike was leaked to the WSJ.
10 minutes pic.twitter.com/JCA3OqR2qM
— Ramp Capital (@RampCapitalLLC) June 15, 2022
Many were saying the market was giving the Fed the opportunity and invitation to hike 75 bps, even though during Powell’s previous statement he said, “A 75 basis point increase is not something that the committee is actively considering.”
This just goes to show how far behind the curve the Federal Reserve is with regards to taming inflation with their policies and “available tools”. In fact, as pointed out by Simon Ree, once inflation goes above 5%, it has never come back down without the Fed Funds Rate exceeding the CPI.
“Once inflation goes above 5%, it has never come back down without the Fed Funds Rate exceeding the CPI” – Druck
— Simon Ree (@simon_ree) June 15, 2022
The problem is the current inflation rate is 8.58% and the effective Federal Funds rate is only 1.58%. A 7% delta leaves a lot of room for the Fed to continue hiking until it starts seeing inflation roll over. Their goal would then be to slow down the magnitude or frequency of hikes (and to get further off of zero in preparation for the next easing cycle) while inflation rolls over so as to encourage the so-called soft-landing.
By the time the Fed catches up, it will likely turn out that they reacted too slowly to start this tightening cycle, and we may have already entered a recession. However, Powell made it clear during his presser last week that they are not trying to induce a recession.
The problem is there are already signals saying we may already be headed for a recession if not already in one. Take a look at the latest GDPNow estimate. It’s currently at 0% with the next update coming on Monday, June 27th. GDPNow is not an official forecast of the Atlanta Fed. Rather, it is best viewed as a running estimate of real GDP growth based on available economic data for the current measured quarter.
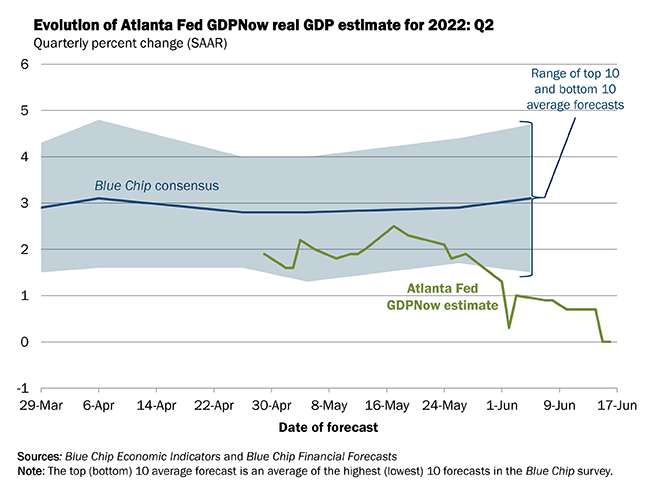
While the consecutive quarters of declining GDP would signal a technical recession (to be confirmed later by NBER), eyes will likely shift back to closely watching the unemployment reports to see if the job market can remain healthy with the Fed pouring cold water on economic activity.
Sam Ro gave a slightly rosier outlook on inflation and the Fed policy in his most recent substack:
While many corners of the economy are slowing all at once, it’s important to remember that most of the slowing metrics are still near record levels. So a recession right now would bring the economy down from very strong levels to slightly less very strong levels.
And if the economy is indeed slowing down and supply chains are indeed improving, then we should soon see prices cooling off or even coming down. This is key because the Fed has been very clear that it will not let up on tightening monetary policy until it sees “clear and convincing” evidence that inflation is easing.
Until we get that evidence, don’t expect stock market to go on a sustained rally.
It’s worth remembering, however, that Powell has repeatedly said that the Fed will move “expeditiously” in its fight to restore price stability. That means that the Fed can decide to ease up as quickly as it decided to tighten up last week.
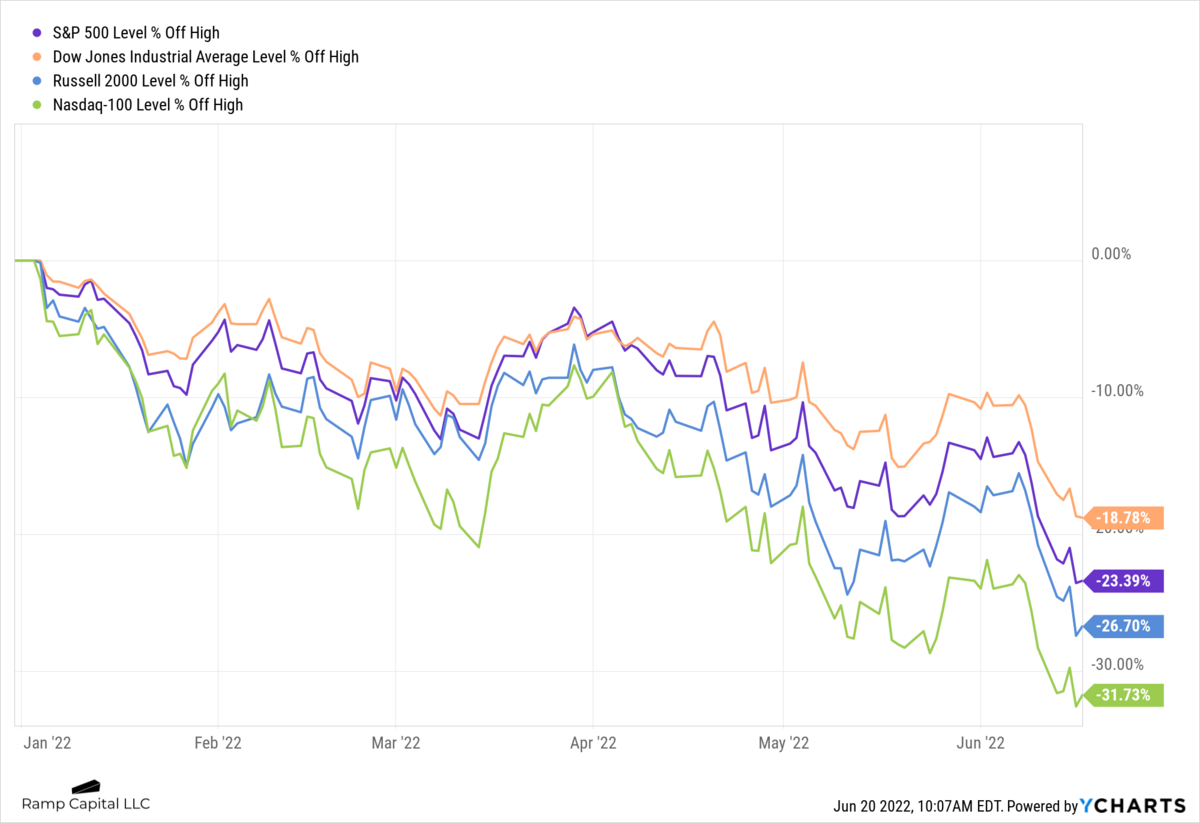
Bear Market Official:
The bear market is finally official based on the last few weeks of drawdowns.
The Dow has still somehow managed to not enter the -20% threshold but it doesn’t matter at this point. You can see this has been an incredibly tough year for investors with really nowhere to hide unless your crystal ball said to go 100% long energy.
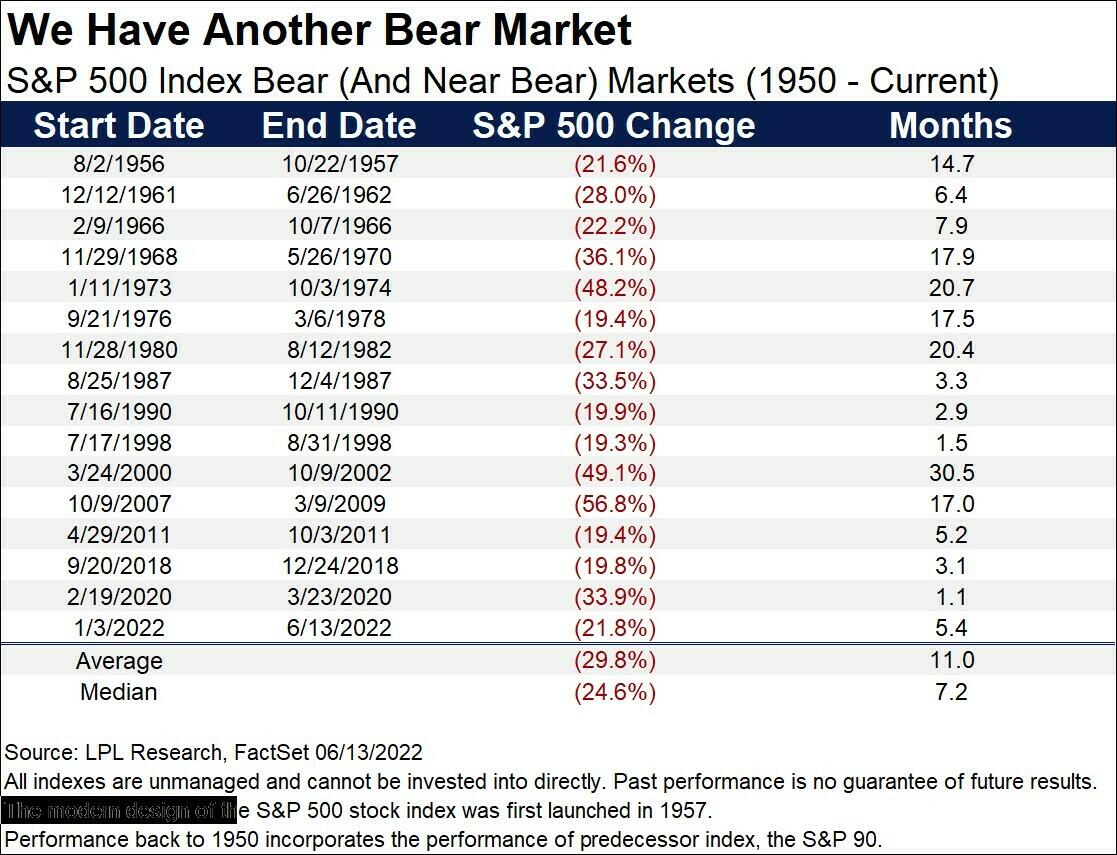
Ryan Detrick shared the table below that lists out all of the bear markets (and near bear markets) since 1950 and how long it took for them to bottom out. As you can see, the average length until bottom is 11 months and the median is 7.2 months. We are currently 5.4 months into this current bear market and it feels like it’s only going to get worse from here. But that’s what they always feel like.
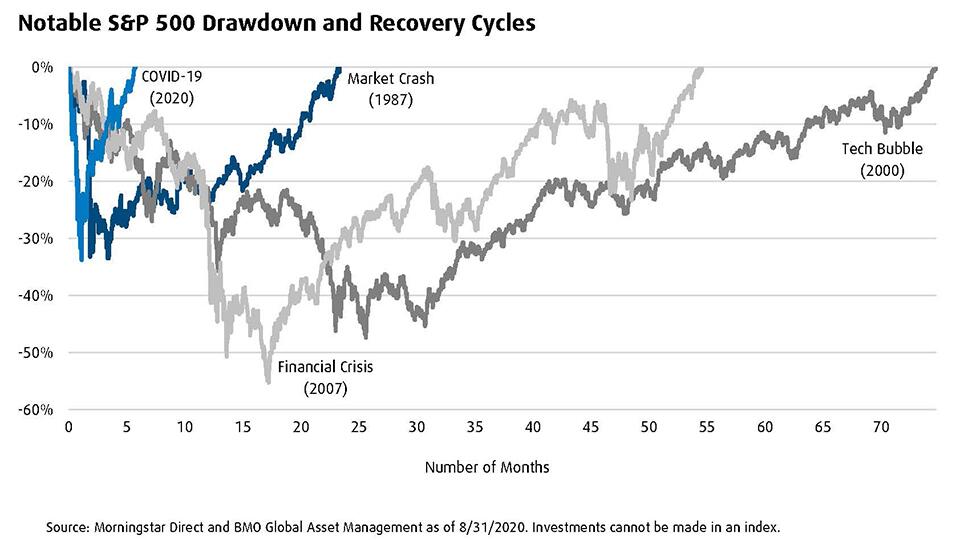
One thing to remember on this table above is it’s the average and median time to hit the bottom. The chart below from Morningstar and BMO shows visually how long it takes for the full recovery to occur.
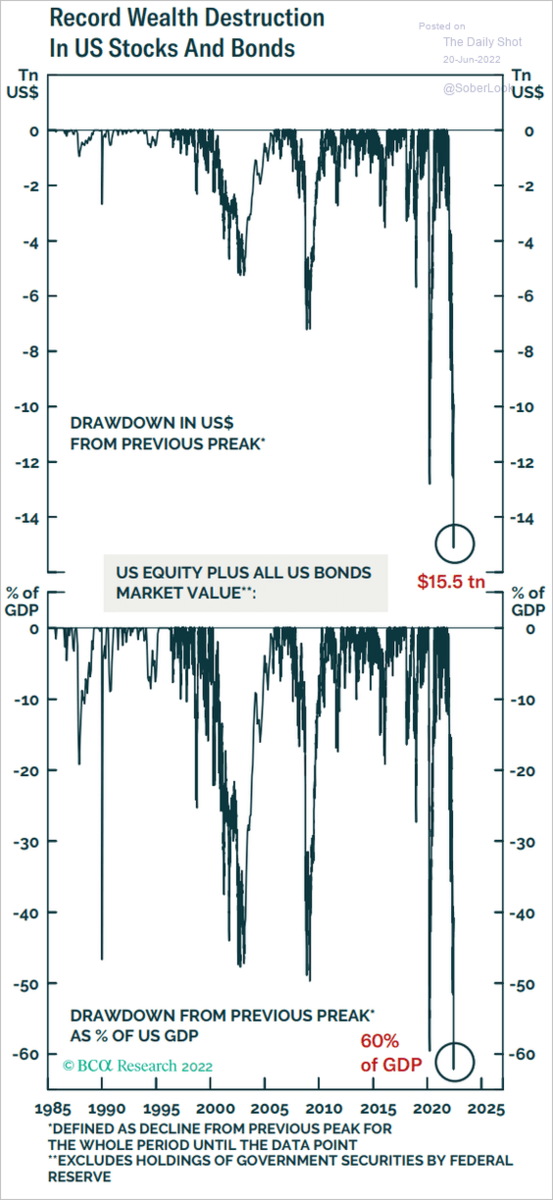
The magnitude of wealth that has been destroyed during this latest rout has now dwarfed previous declines.
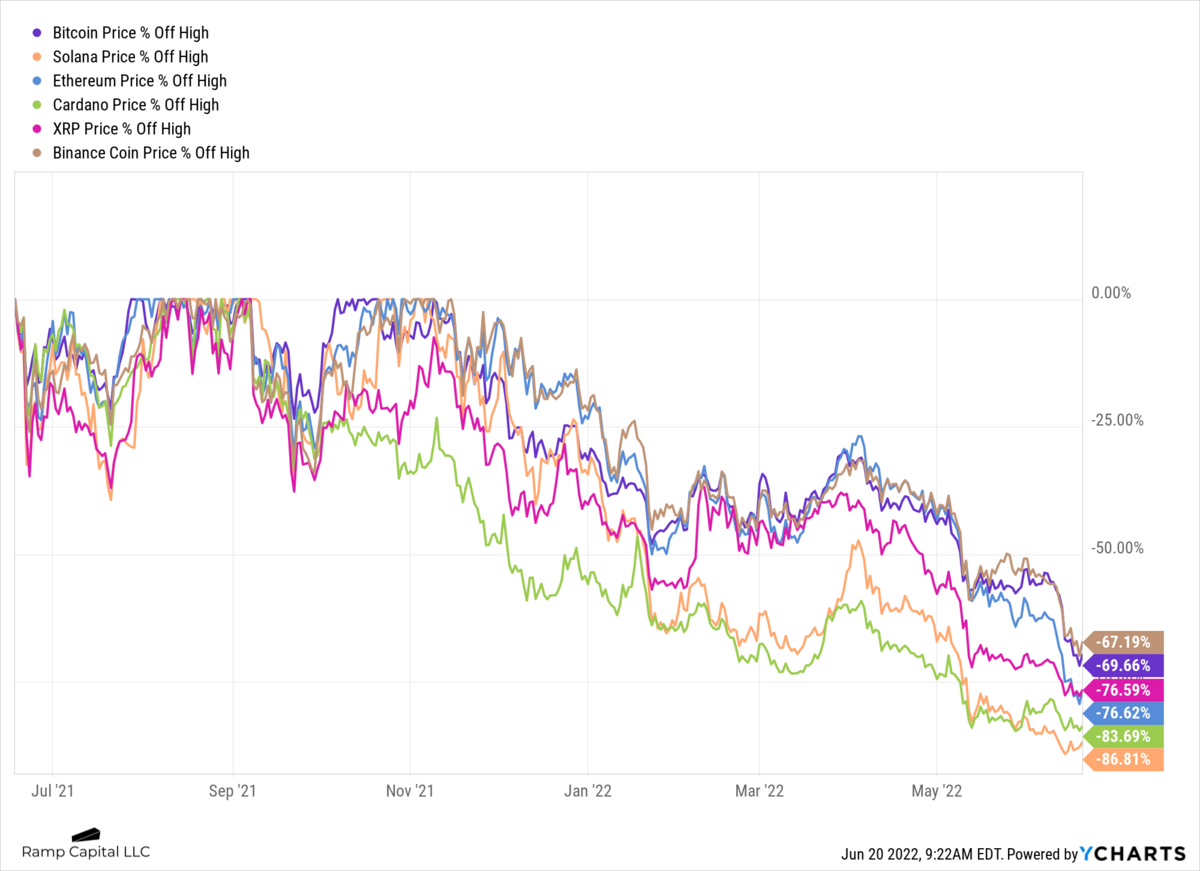
Crypto Winter:
The entire crypto market has been annihilated, falling below $1T total market cap. For reference, it hit nearly $3T total market cap in early November of last year. Which makes the chart on wealth destruction in the previous section even more frightening.

While many cryptonerds who’ve been around long enough will say “first time?” it does seem to have a “it’s different this time” feel to it. That’s due mainly to depegging of stablecoins and deleveraging liquidations which have sent shock waves throughout the entire crypto ecosystem.
Will Hershey, CEO of Roundhill, gave his take on the recent collapse of the crypto markets. He echoes my recent sentiments that the bad actors will hopefully be forced out and the builders will win. But many people who invested in this space are gone forever.
Following the collapse of the Terra and Luna cryptoassets in May, a risk-off environment has taken hold of the crypto ecosystem. In addition to a broader market shift away from long duration assets, the use of excessive leverage, liquidity mismatches on carry trades, and the concentration of holdings amongst a handful of players has contributed to contagion in the sector. The impact thus far has largely been contained within the crypto ecosystem, although it’s worth noting that the discount on the Grayscale Bitcoin Trust has widened to its largest discount to NAV in history (34% as of Friday’s close). While it’s unclear if there are more shoes to drop, sentiment has unquestionably shifted from euphoria to fear in a matter of months. In the short term, this is likely to be a negative for cryptoassets (including the likelihood for increased regulatory scrutiny), but longer-term represents a positive outcome. Quite simply, there was too much leverage built up in the system, including both onchain via DeFi and via centralized entities. Once the leverage can be unwound (either forceably or by gradual de-risking), investors can re-focus their efforts on supporting the individuals and teams building blockchain-based applications that offer use cases beyond financial speculation. In my view, the glass half full view of this “crypto winter” is that it will allow for a renewed emphasis on the underlying technology being built, rather than short-term price fluctuations.
One thing I know is that there are lessons to be learned during these tough times, and they apply to both crypto and stock markets. Have a read through some of these if you haven’t already come up with your own.
What lessons have we learned from the crypto meltdown?
— Ramp Capital (@RampCapitalLLC) June 14, 2022
My biggest takeaway, which is cliché but still holds true, is that if it looks too good to be true it probably is. Nick Maggiulli summed this up perfectly in a recent blog post.
That killer deal you think you’ve found probably isn’t so killer after all. It’s more likely that you found something with hidden, unknown risks. This is why I believe that earning a yield a little higher than U.S. Treasuries is plausible, but earning 20% a year in a “risk-free” stablecoin is not. There’s nothing risk-free or stable about it.
Too Good to Be True – Of Dollars And Data
The most annoying part of this recent boom-bust cycle in crypto was the “have fun staying poor (HFSP)” movement on the way up and boomer schadenfreude displayed by nocoiners on the way down. It sucks in people on the way up and spits them out on the way down.
I don’t know if this will end up being the bottom for crypto, but I think it will be tough for coins to increase in value if financial conditions continue to tighten, as they are currently viewed no different than unprofitable expensive tech stocks.
That’s all for this week. Thanks for subscribing and sharing.
Tyler Durden
Tue, 06/21/2022 – 16:20
Continue reading at ZeroHedge.com, Click Here.