
Feature your business, services, products, events & news. Submit Website.
Breaking Top Featured Content:
Bonds Bid As Nasdaq Faces Worst Drawdown Since ‘Lehman’
And the word of the day is…
Another chaotic day in the illiquid US equity markets with bloodbathery rescued in the last hour by yet another magical mysterious bid helped by SF Fed’s Mary Daly commenting that hiking by 50bps per meeting is likely (which somehow the market sees as bullish!!!)…

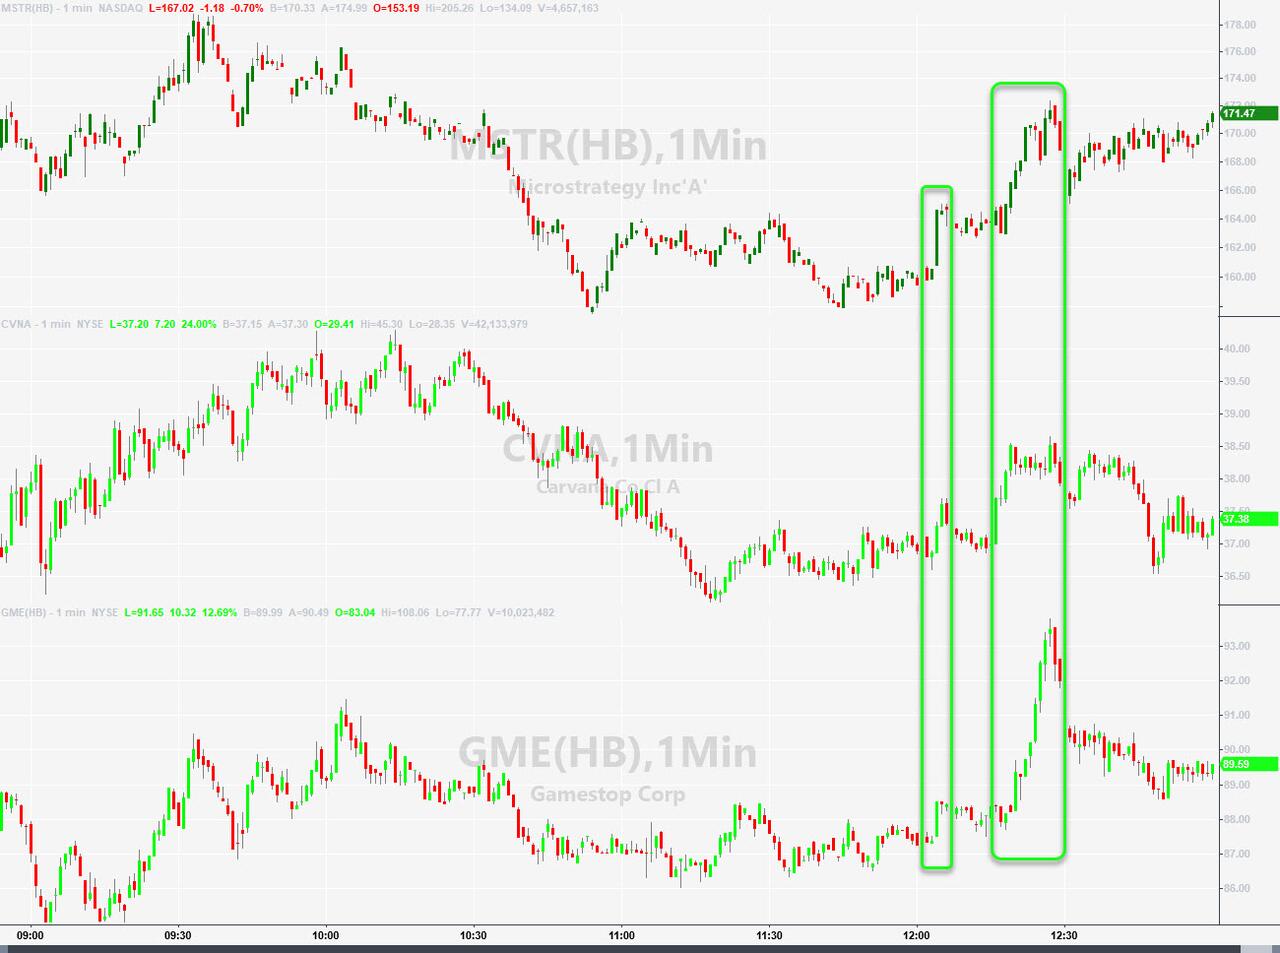
The ramp at the close had the smell of a short-squeeze test – look at the price action in CVNA, MSTR, and GME – someone was testing them for a squeeze…
The S&P 500 came within 2pts of its bear market today (3855 was the level and it seemed like someone really didn’t want that to happen)…

…but the Nasdaq is now down 32% from its highs – the biggest drawdown since the Great Financial Crisis…

Here’s one way of looking at it!

SF Fed’s Daly came in late in the day and said she “would like to see continued tightening of financial conditions.”
Things would be getting serious if that’s the case as The Fed clearly thinks that crashing the stock market will somehow unlock broken supply chains and ‘fix’ inflation…

Source: Bloomberg
If financial conditions tighten much further, they will be at their tightest since the European financial crisis! Will The Fed still stand its hawkish ground?
The current aggregate bottom-up analyst consensus forecast for the S&P 500 by year-end is 5119… which is a 32% rally from here!
While Bloomberg Intelligence sees a ‘base case’ for the S&P above current levels, downsides from a recession… or stagflation… are considerably lower…

Source: Bloomberg
The S&P 500 would only need to fall another 4.4% to 3,760, which is the level where investors are pricing in a U.S. economic downturn, BI data shows.
“It doesn’t mean a recession is imminent because there is still a lot of strength in the U.S. economy, but it seems like the market is starting to think it’s possible,” Wolff said.
“If the market is pricing one in, we still have more room to fall. That’s another sign we haven’t bottomed entirely yet.”
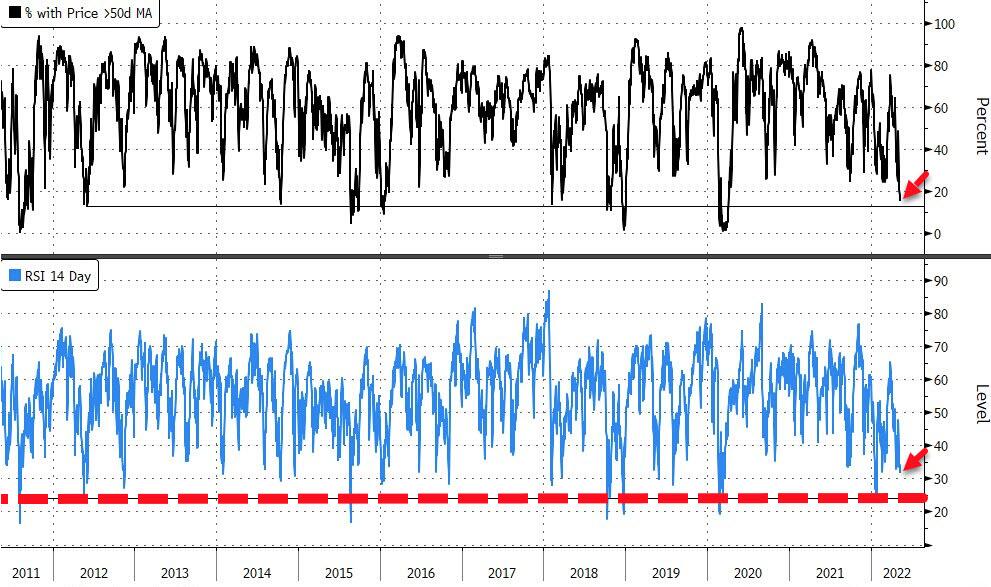
Since 2009, each major decline in the S&P 500 of 15% or more saw the portion of stocks trading above their 50-day moving average drop to 5% or less, while the 14-day relative strength index fell below 30, according to Bloomberg Intelligence. Currently, both of these metrics still exceed those prior thresholds: The portion of equities in the benchmark index that trade above their 50-day moving average is 15% and RSI sits at 32.
Source: Bloomberg
“Why aren’t we oversold? It’s because there still hasn’t been panic selling,” said Andrew Thrasher, a technical analyst and portfolio manager at Financial Enhancement Group.
“People aren’t running out the door with their hair on fire. When large declines are led mostly by mega-cap tech and growth stocks like Apple, Amazon and Tesla, we won’t see a big washout in breadth.”
Source: Bloomberg
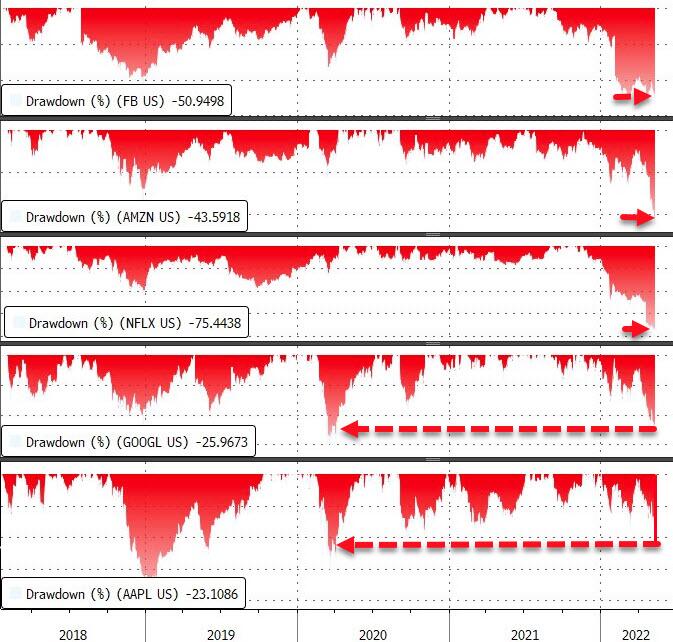
The lack of “capitulation,” or a sign of a bottom in stock prices, is likely the result of investors hanging on to U.S. equities as an inflation hedge, particularly as value and low-volatility stocks continue to hold up well, according to Gillian Wolff, senior associate analyst at BI.
“When there’s a market bottom, nearly all of the equity market typically sells off. But this massive decline still isn’t the end,” Wolff said.
“We haven’t reached the low yet because we’re coming off pretty inflated earnings for mega-cap growth stocks. There’s still so much room to fall even as investors dump expensive tech shares.”
The S&P 500 will likely head even lower and test a notable Fibonacci 38.2% retracement level at 3,815 before finding support, according to Mark Newton, a technical strategist at Fundstrat Global Advisors.
“Despite sentiment having turned bearish, there hasn’t been sufficient capitulation yet,” Newton said in a note to clients.
“While price is getting nearer, time still looks early for a low, which points to June as being more probable. Bottom line, if 3,815 is broken, it could be likely that 3,500 might come into play.”

Source: Bloomberg
As stocks have puked, VIX has refused to spike to give the squeezers any vol-selling ammo for a bounce…
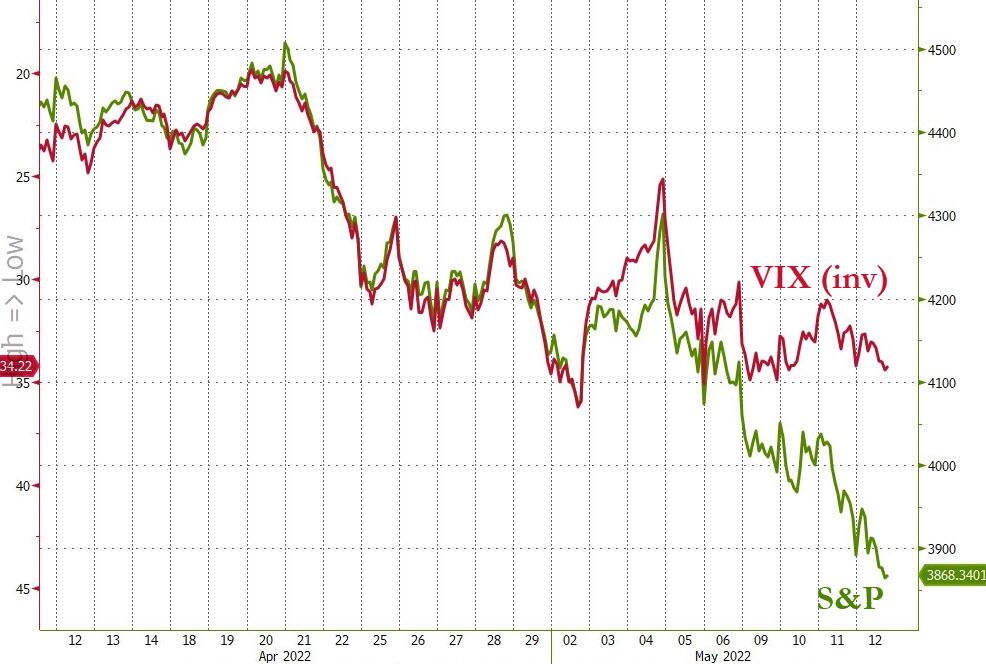
Source: Bloomberg
Treasuries were bid across the curve with the short-end outperforming (2Y -10bps, 30Y -4bps). On the week, the belly is leading the drop with 5Y/7Y down 30bps!
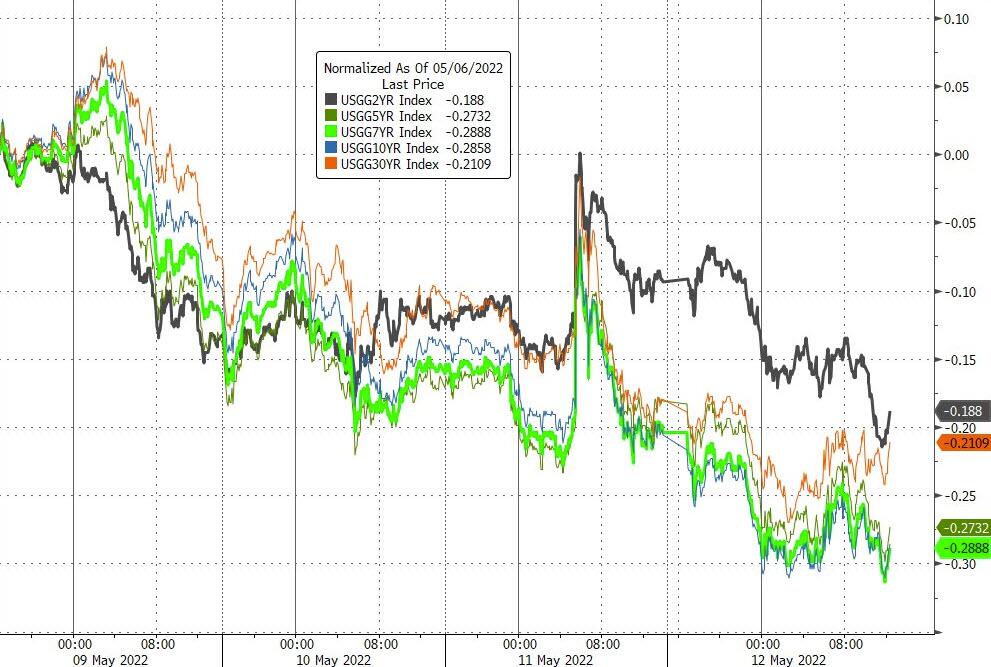
Source: Bloomberg
10Y yields are now well below 3.00% and today’s 30Y auction yielded 2.997%…
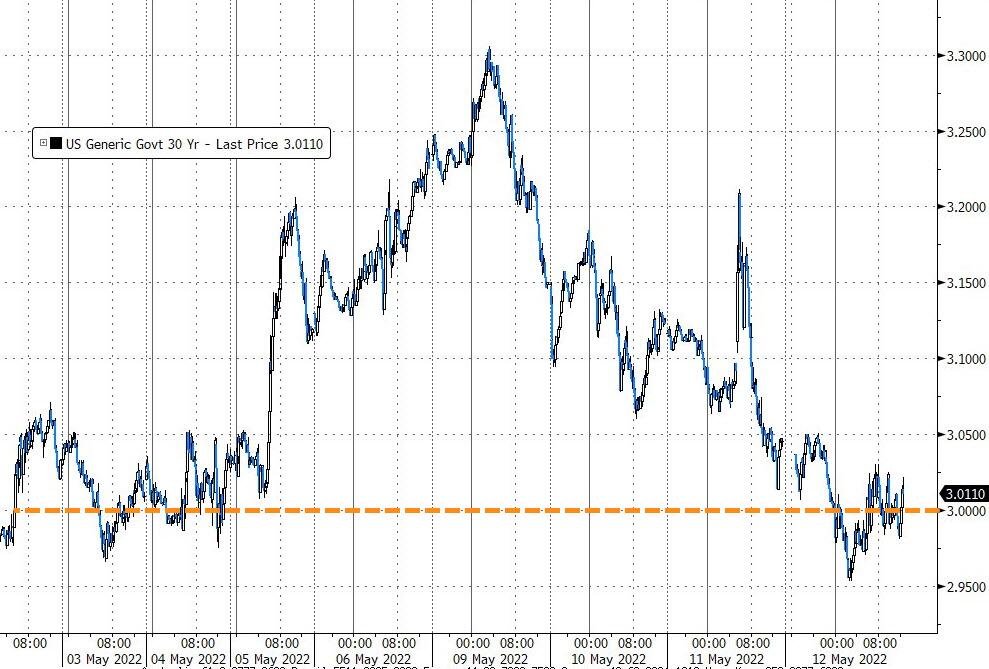
Source: Bloomberg
Notably, the post-CPI hawkish shift in rate-expectations has been erased as stocks puke – suggesting the market is starting to call The Fed’s inflation-fighting bluff in the face of stock market carnage…
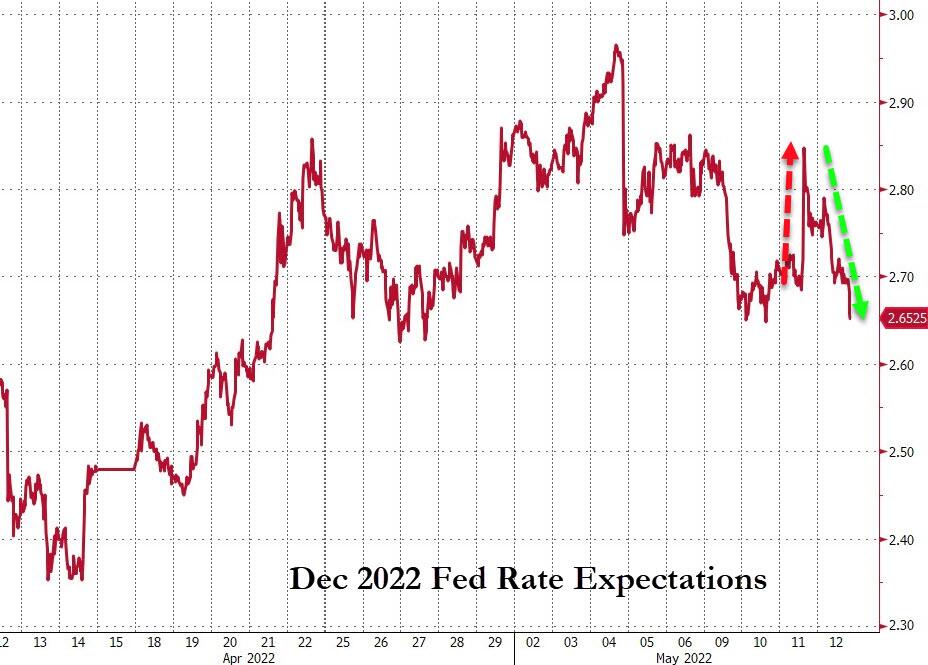
Source: Bloomberg
The dollar extended yesterday’s gains, holding up near 20 year highs, breaking out of the post-FOMC plunge range…
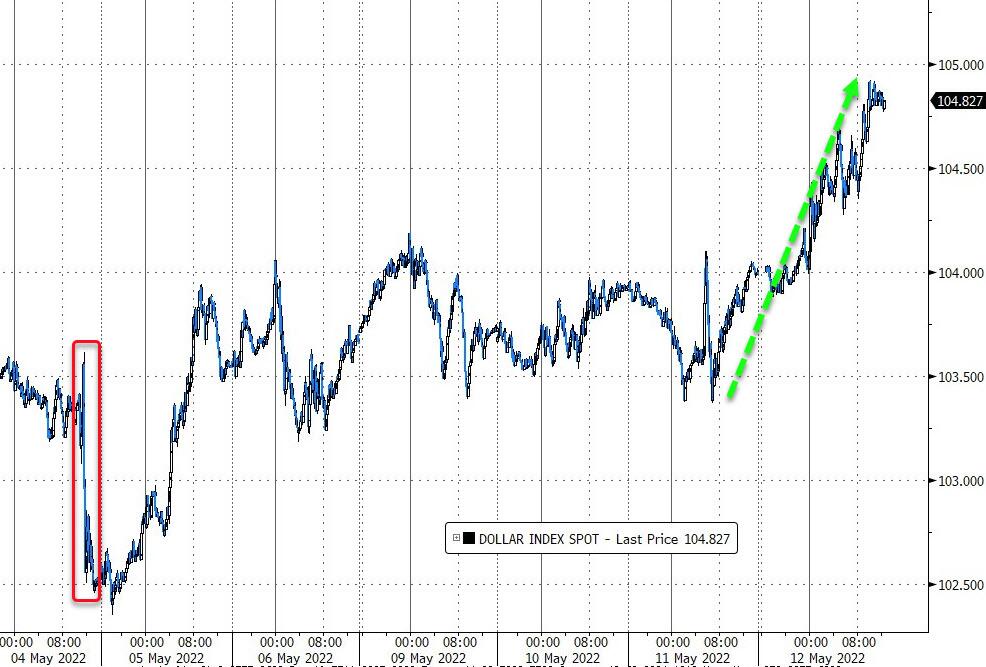
Source: Bloomberg
Bitcoin crashed below $26,000 overnight – erasing all of 2021’s gains – then bounced back to almost $30k intraday before sliding back as the equity market weakened in the afternoon…
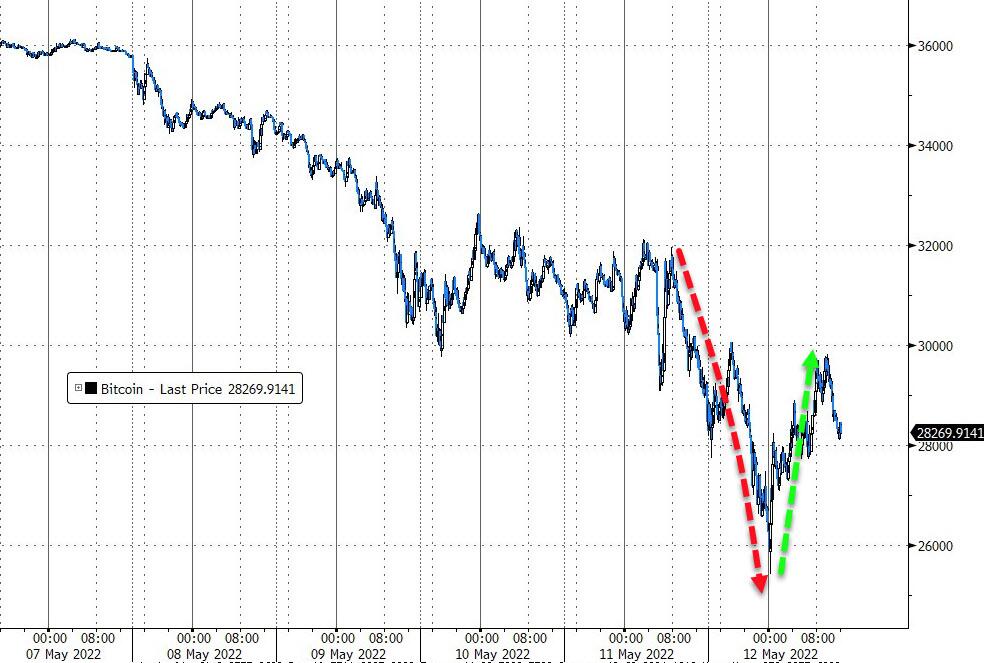
Source: Bloomberg
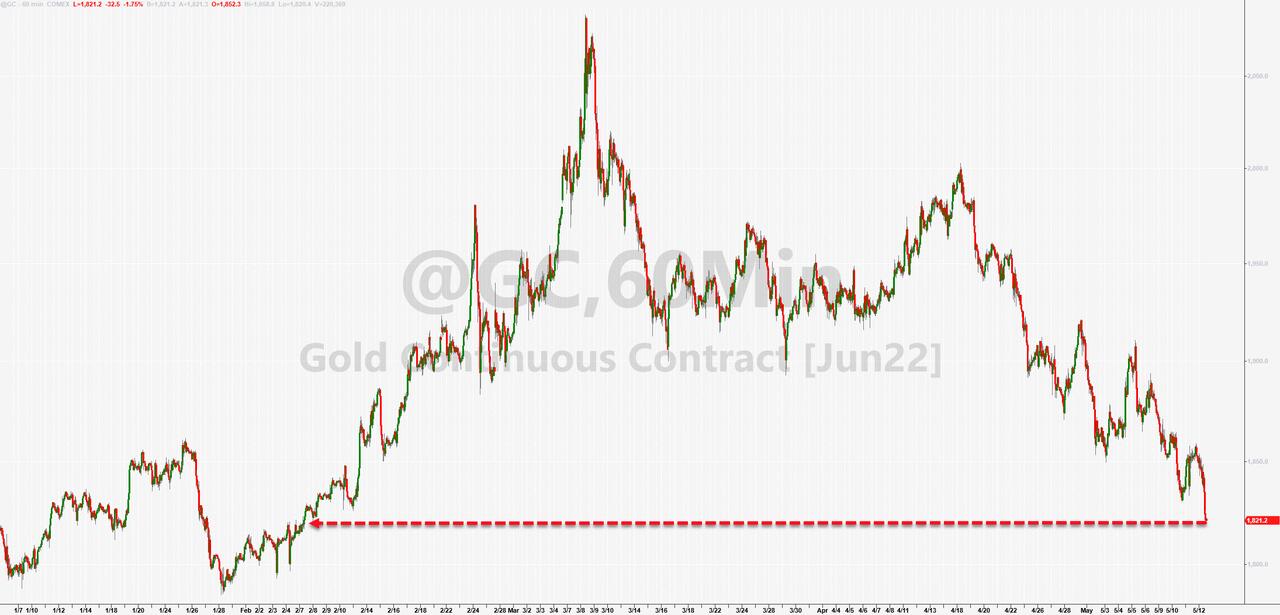
Gold tumbled to its lowest since early Feb…
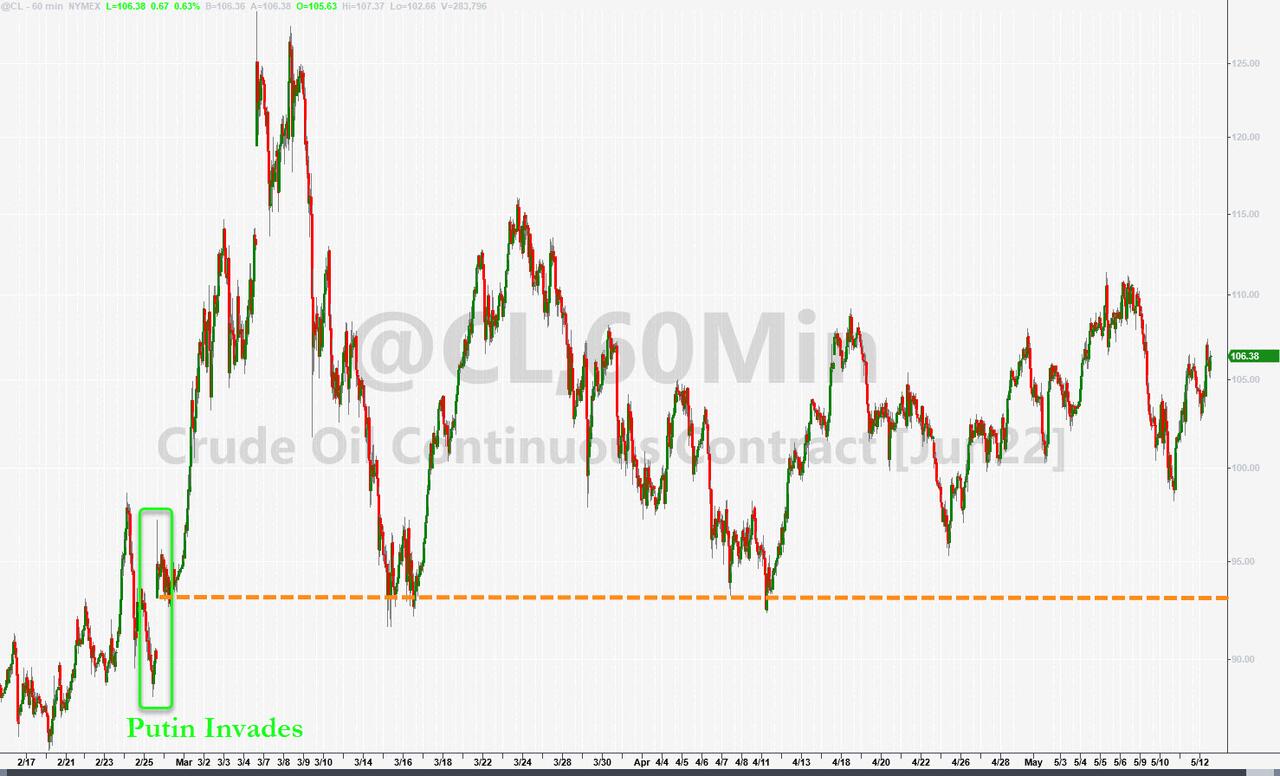
Oil clung to gains today with WTI holding above $106 (well above pre-Putin levels and above Biden’s SPR release levels)…
Finally, the Build Bear Bigger market rolls on…
Source: Bloomberg
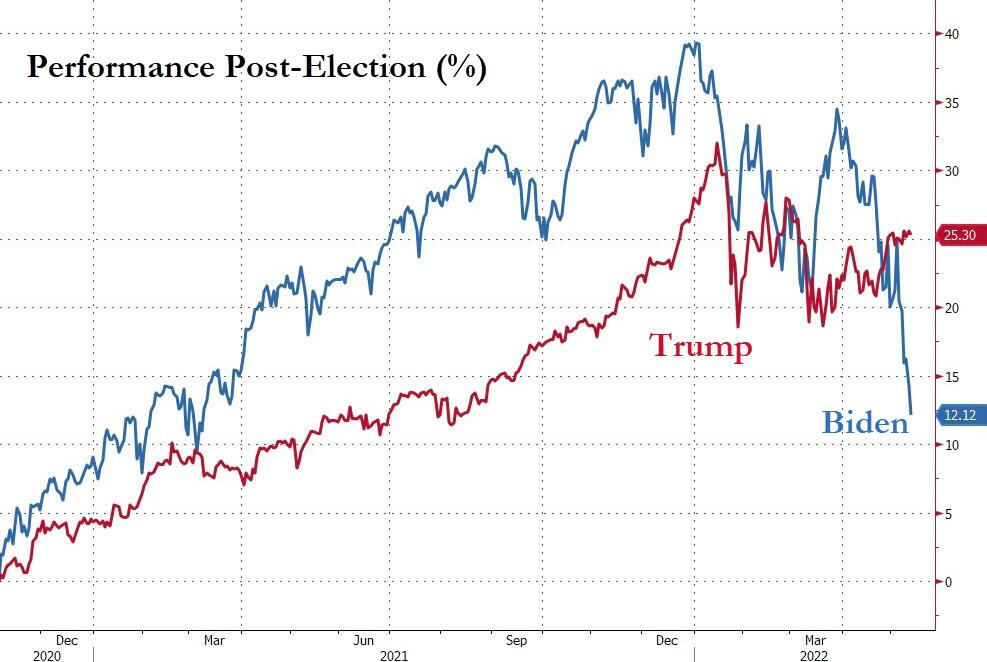
As Jen Psaki remarked earlier in the year, “unlike his predecessor, President Biden does not look at the stock market as a means by which to judge the economy.”
But it could be worse…
Top of the morning guys @KeithMcCullough @Hedgeye @Keubiko $GK pic.twitter.com/YxewqI5XAP
— J (@ROICAHOLIC76) May 12, 2022
Remember, you never go full Gerber.
Tyler Durden
Thu, 05/12/2022 – 16:01
Continue reading at ZeroHedge.com, Click Here.