Feature your business, services, products, events & news. Submit Website.
Breaking Top Featured Content:
SF Fed ‘Proxy Rate’ Signals Most-Inverted Yield Curve Since 1981
Authored by Steve Vannelli via Knowledge Leaders Capital blog,
In a recent San Francisco Federal Reserve Publication titled “Monetary Policy Stance is Tighter Than Fed Funds Rate,” the authors argue that the “all in” policy rate is actually higher than the Fed Funds rate would suggest. They open:
“The Federal Reserve’s use of forward guidance and balance sheet policy means that monetary policy consists of more than changing the federal funds rate target. A proxy federal funds rate that incorporates data from financial markets can help assess the broader stance of monetary policy.”
How is the rate constructed? Per the Fed’s explanation:
“This measure uses a set of 12 financial variables, including Treasury rates, mortgage rates, and borrowing spreads to assess the broader stance of monetary policy. Using principal components, common movements among the 12 financial variables are extracted. The first three principal components are then mapped to levels of the federal funds rate, where the mapping reflects the pre-2008 correlations between them. Until December 2008, the mapping is nearly exact by construction; after 2008, the mapping from financial conditions to the funds rate diverges. This separation displays how the proxy funds rate responds to developments in financial conditions such as forward guidance and balance sheet operations.”
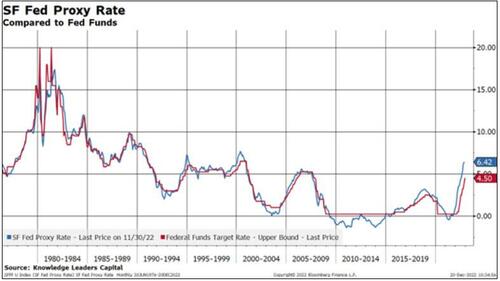
The SF Fed is kind enough to post the data behind the rate so I can download and analyze it. Below is a picture of the rate alongside the traditional Fed Funds rate.
The first, simple observation, consistent with the Fed’s study is that the proxy is considerably higher than the simple Fed Funds rate. This hasn’t always been the case, especially in the 2008-2014 period when the Fed was accumulating assets and providing dovish forward guidance.
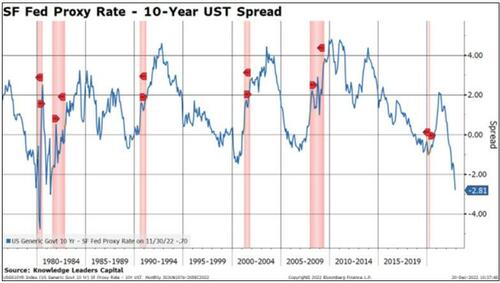
Next, let me use the proxy rate to calculate the yield curve inversion out to 10 years. At -281bps currently, this is the deepest inversion since 1981. Importantly, every single recession since 1980 has been preceded by a 1+% inversion, helping explain the cacophony of calls for a recession next year.
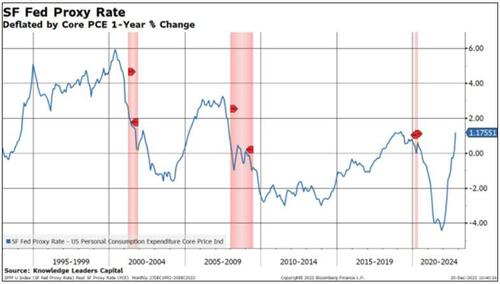
The Fed has repeatedly expressed the need to get the Fed Funds rate above the inflation rate to create a positive real fed funds rate. Mission accomplished! The SF Proxy rate deflated by the core PCE price index 1-year percent change is now +1.17%, nearly equal to the level that precipitated the last recession.
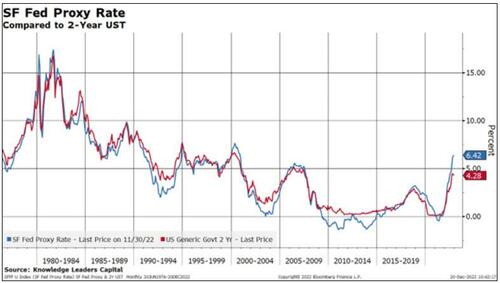
Perhaps the market senses that this elevated proxy rate is enough to cool the US economy significantly in the quarters to come, helping explain why 2-year US Treasury yields appear to be rolling over. Historically, once the Fed Funds rate hits the 2-year UST, that tends to signify the end of the tightening cycle.
The SF Fed wraps up its research piece with:
“Looking at the funds rate alone would suggest that policy is relatively looser than most rules would prescribe. In contrast, by accounting for the broader stance of policy, our proxy rate indicates that policy is tighter than most rules prescribe.”
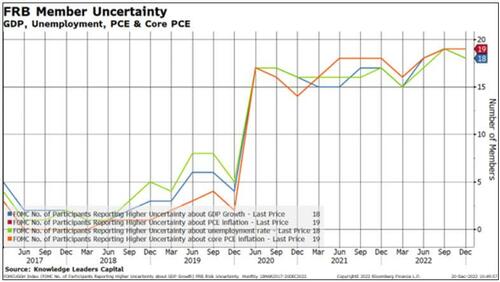
Perhaps reflective of the uncertainty of how this new proxy rate will impact the economy, the Fed, in its last meeting, was almost unanimous in its assessment of uncertainty regarding the path of growth, employment and inflation.
* * *
Tyler Durden
Wed, 12/21/2022 – 14:19
Continue reading at ZeroHedge.com, Click Here.

