
Feature your business, services, products, events & news. Submit Website.
Breaking Top Featured Content:
Bitcoin Experiences a Dip to A Key Moving Average. What’s Next?

Bitcoin is up 44% on a monthly basis but has slid 12.5% since setting an all-time high of $67,000 on October 20. Is this just a healthy correction in a larger uptrend, or should investors consider de-risking on bounces?
Meanwhile, it seems that certain US senators and the private sector have similar views on bitcoin’s place in a world of runaway inflation.
Let’s dig in.
Senator Rand Paul Exalts Crypto as The Global Reserve Currency of the Future
Senator Rand Paul believes that cryptocurrency may turn out to be the reserve currency of the world in the future, according to an interview aired last week.
Speaking to Axios, the US Senator, who is known for his deep skepticism of big government, voiced concerns about the reckless attitude governments have taken with their currencies, stating that crypto could be a viable alternative.
Check out the full article here!
Technically speaking
When moon?
Bitcoin slid to $57,900 earlier today, forming a fresh local low amidst an environment of skittish and over-leveraged traders. Let’s consider the context.
2-hour (LTF) turns neutral to bearish
On the 2-hour chart, BTC/USD traversed below the 200-EMA, marginally remaining within a descending wedge at the time of writing. The ‘W’ structure described in the telegram channel is technically invalidated. While oversold on both RSI indicators, prices have not recovered above the moving average yet, suggesting that bounces could be de-risking opportunities on this time frame.
While a deviation is certainly possible if the RSI indicators recover from oversold territory and prices do not reclaim the EMA, then one can anticipate further selling pressure in the coming hours. Notably, funding has turned negative on LTFs and neutral on HTFs, indicating increasing risk of liquidity hunts against aggressive shorters.
Daily (HTF) tests 20-ema
Despite the low-time frame neutral-to-bearish posture, the daily chart indicates that this retest is normal and healthy.
Unless prices close below the 20-daily EMA ($58,900), the bearish case remains shrouded and unclear. Admittedly, rarely is something ever crystal clear in this racket.
Still, one ‘max pain’ scenario that would pillage and burn both sides could be a more severe intra-day wick that subsequently reverses and closes back within bullish territory.
In any case, the daily super-trend rests at $56,200 and is a ‘BTFD’ moment, if it materialises.
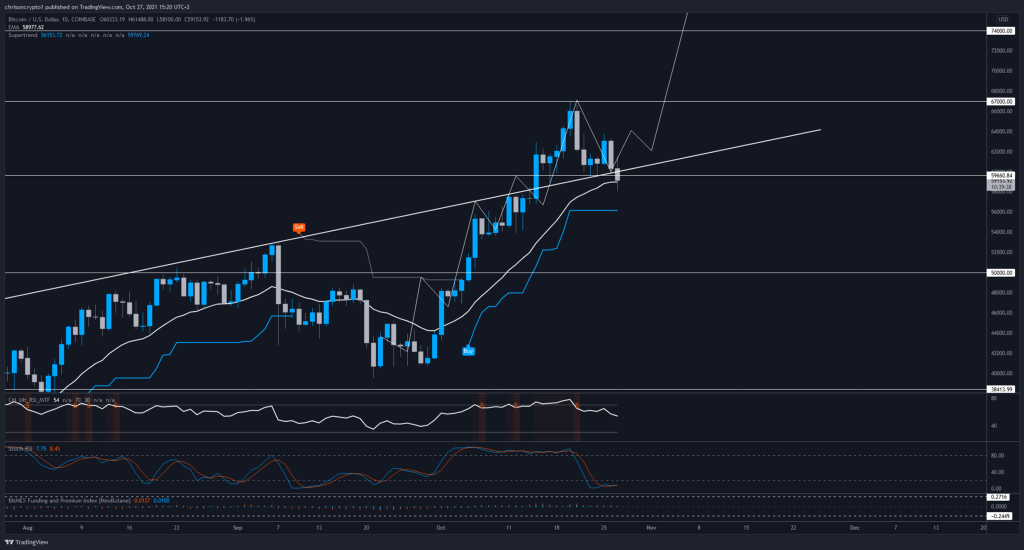
That said, lower prices are not guaranteed. The RSI has reset to neutral territory (55), while the stochastic RSI has been in oversold territory since the 23rd Oct.
The seemingly conflicting nature of low (LTF) and high time (HTF) frame price-action and indicators is a testament to the eternal conflict of time-frames and the cyclicity of financial markets. But perhaps that’s a story for another time.
To begin wrapping things up, the high time-frame picture is bullish, while low time frames are neutral-to-bearish.
One reason for the relative bearishness is due to traders over leveraging every small move and ultimately getting wiped out. In almost all circumstances, the high-time frame picture is more relevant and telling of what’s to come than futures-led liquidity hunts.
As it happens, the context is absolutely essential: Bitcoin has just made new highs, reaching an all-time high of $67,000 before cooling off, which (*clears throat*) we predicted down to the cent.
The question now is whether there’s enough demand to offset the fresh supply. For this reason, we can take a closer look at on-chain data, as it is more suitable for determining bigger trends.
The exchange net-position change is within negative territory, meaning that outflows continue to offset inflows. Of course, there are two reasons why investors send bitcoin to and from exchanges, to hodl or sell of fiat or USDT.
Currently, coins are being hodled by and large, though some long-term investors have begun to take profits, as evidenced by the flatlining exchange net position change below.
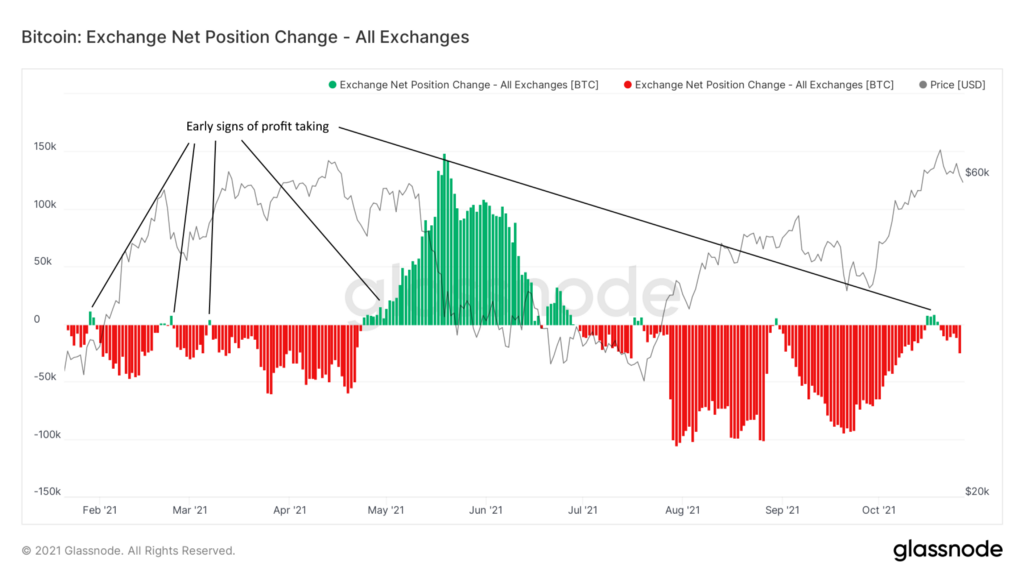
This is normal at all time highs, and it remains to be seen how investors will react when BTC/USD traverses higher. Bear in mind, when bitcoin sets an all time high, this is typically the beginning of a trend not the end of one.
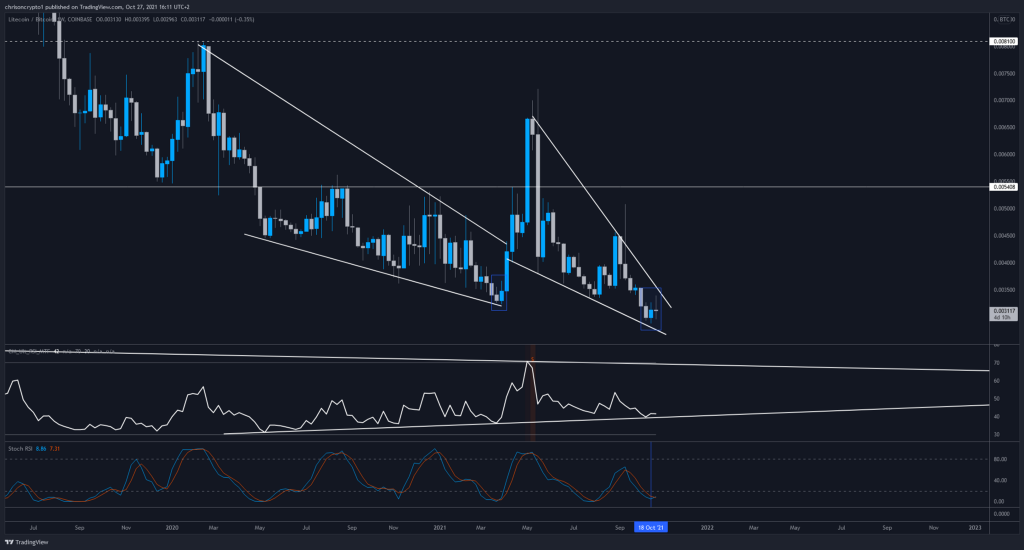
LTC plays mind games
Meanwhile, the Litecoin trade continues to play with investor emotions by continuously faking out. Regardless, I would submit that it’s hard to be bearish on a chart that’s printing weekly divergences against BTC.
The bull market is a bumpy ride, but it’s not over until it’s over.
Catch you later.
p.s. This is my opinion. You can have your own opinion.
Join the Telegram channel for live updates & setups!
Follow me on Twitter & Gab and my social portals below.

Read More: Senator Rand Paul Exalts Crypto as the Global Reserve Currency of the Future

You can also support me in Bitcoin!
BTC address: 3EydsEYpjHn68axKnCUqBB7EbqcxrEjamr

Best regards,
Christopher Attard
Founder of Chris on Crypto
Contributor to www.cityam.com
Connect directly on: Telegram
p.s. This is my opinion. You can have your own opinion.
Originally published at https://mailchi.mp.
Check out our new platform 👉 https://thecapital.io/
https://twitter.com/thecapital_io
Bitcoin Experiences a Dip to A Key Moving Average. What’s Next? was originally published in The Capital on Medium, where people are continuing the conversation by highlighting and responding to this story.