Feature your business, services, products, events & news. Submit Website.
Breaking Top Featured Content:
Stock Valuations Surpass 1929 Levels

Tyler Durden
Thu, 12/03/2020 – 15:20
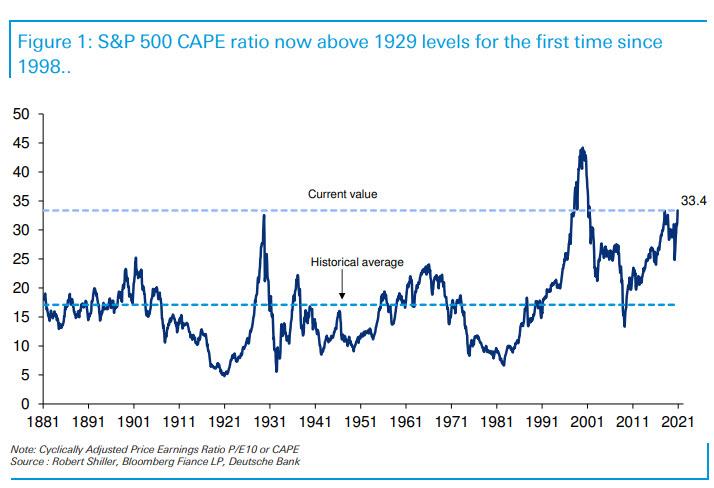
As DB’s Jim Reid wrote in his Wednesday chart of the day, “one chart that I’ve used in various forms ever since I read “Irrational Exuberance” by Robert J. Shiller back in March 2000 is the S&P 500 CAPE ratio of the S&P 500. This is the cyclically adjusted P/E by looking at 10 years of earnings not the current. The chart is a regular in my chart book and with last night’s close, this CAPE ratio has now climbed to its highest ever level outside of the 2000 bubble period.”
While the CAPE ratio has yet to surpass the dot com bubble euphoria, Reid notes that we have gone above the level seen on the eve of the 1929 stock market crash and the recent peak in January 2018.
As the DB credit strategist further notes, “we have 1679 monthly observations back to 1881 and the CAPE was higher than current for 38 months between early 1998 to early 2001. Outside of this it’s never been higher than where it is today.”
Of course, Reid is quick to point out that a great depression crash isn’t imminent, caveating that “the CAPE ratio is not perfect for many reasons and note we’ve been above the long-term average of 17 since early 1991 outside of 10 months during the GFC. So if this ratio does mean revert (which it probably does) it can take a lifetime of investing and structural shifts to do so in both directions.” He goes on to remind the few remaining human traders who actually care about fundamentals that the most used justification for current structural higher CAPE than long-term averages is the four decade decline in yields to what are now close to all time multi-century lows (which are there only because of central bank intervention in both the bond market and the broader economy, where the Fed’s interventions are deflationary as we have repeatedly shown, and contrary to what central bankers themselves think).
So as Reid concludes, while there is “clear reason why these numbers are elevated… how elevated they should be is a bigger discussion especially as we’ve now gone past September 1929 peak levels and we currently have the largest stocks influencing the index in a way they probably never have before.”
His personal view is that the path of those 10 megacap stocks, which have greatly benefited from the pandemic, “could be the most interesting thing to watch in 2021”, and to this we would add that the “reflation rotation” into value and out of deflationary giga-caps which have led the market for much of the past decade, will determine how stocks trade in 2021.
In retrospect Reid’s clients probably did not enjoy being reminded that we are now living in the biggest bubble ever, because in this morning’s Early Morning Reid note which he publishes every day, he writes that: “I got the most amount of incoming emails yesterday to one of my CoTD’s since it was launched back in early July…. There are reasons why the CAPE may have structurally shifted higher, with an often-used one being the four-decade decline in yields to what are now close to all-time multi-century lows. That said, the fact that we’re beyond the September 1929 levels is obviously an important milestone, and will only add to concerns that current US equity valuations have become disconnected from real economic performance. As we said in the piece this ratio is heavily skewed towards the mega-cap growth stocks and as the world normalizes post pandemic they’ll be the key to valuations over the next few months and quarters. Can they maintain their value even as cyclicals rebound?“
Continue reading at ZeroHedge.com, Click Here.

