
Feature your business, services, products, events & news. Submit Website.
Breaking Top Featured Content:
Goldman: This Is The Biggest Equity (BTD) Dynamic Of 2021
Just three weeks ago in the middle of a blockbuster Q2 earnings season when stocks were surprisingly unable to break out to new all time highs despite the strongest earnings on record, sentiment shifted among some of the biggest banks with Goldman leading the charge and warning that stocks were entering the worst seasonal period for the year…
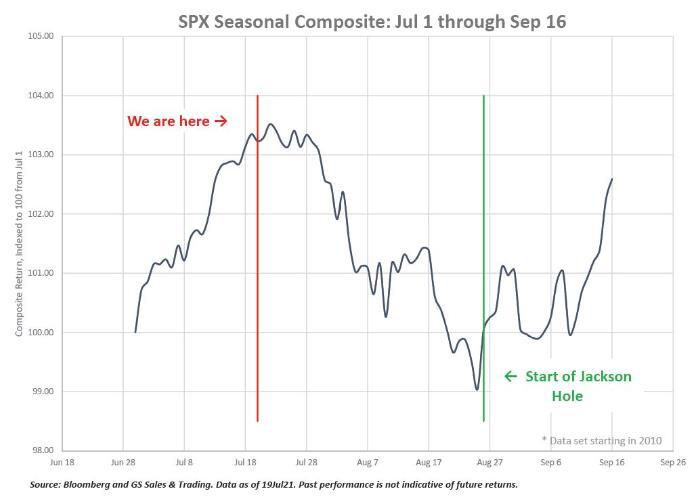
… which together with 10 other reasons published in late July by the bank’s flow trader Scott Rubner,, laid out why Goldman was bracing for an August correction. However with half of August already in the record books, not only are stocks refusing to comply with Goldman’s gloomy outlook but are hitting new all time high every single day. What’s going on and how could the most reputable investment bank get things so wrong?
Well, according to Rubner who over the weekend published a post-mortem on his previous call, the reason is two words: retail investors, or as he explains in his latest Tactical Flow of Funds report, “This is the biggest equity (BTD) dynamic of 2021.”
As Rubner writes, the number #1 incoming question to hit his desk this week: “where is all of this money coming from”? Specifically, this the 3rd straight week of Equity, Bonds, and Cash, going back-to-back-to-back, inflows with literally every sub-category showing inflows, something which the Goldman strategist said three weeks ago was not meant to happen. And yet, that’s precisely what is going on.
According to Rubner, the big change in equities this week is that money is going back into reflation trades (banks, materials, non-China EM, Europe, etc.) with Goldman’s flow desk saying it is “seeing no signs of FOMO (fear of missing out), but we are seeing signs of FOMU (fear of materially underperforming)”, in other words, “Institutional positioning has decreased, while retail positioning has massively increased.”
Putting the unprecedented market flows in context, Rubner writes that there have been more inflows in the last 41 weeks (+$852 Billion) than I have been tracking fund flows for the last 18 years combined. Below is a thread of the Goldman trader’s latest thoughts:
Global Equity 2021: Checklist. No outflows, No correction.
1. Global Equities have logged +$605 Billion worth of inflows YTD as of week 31….
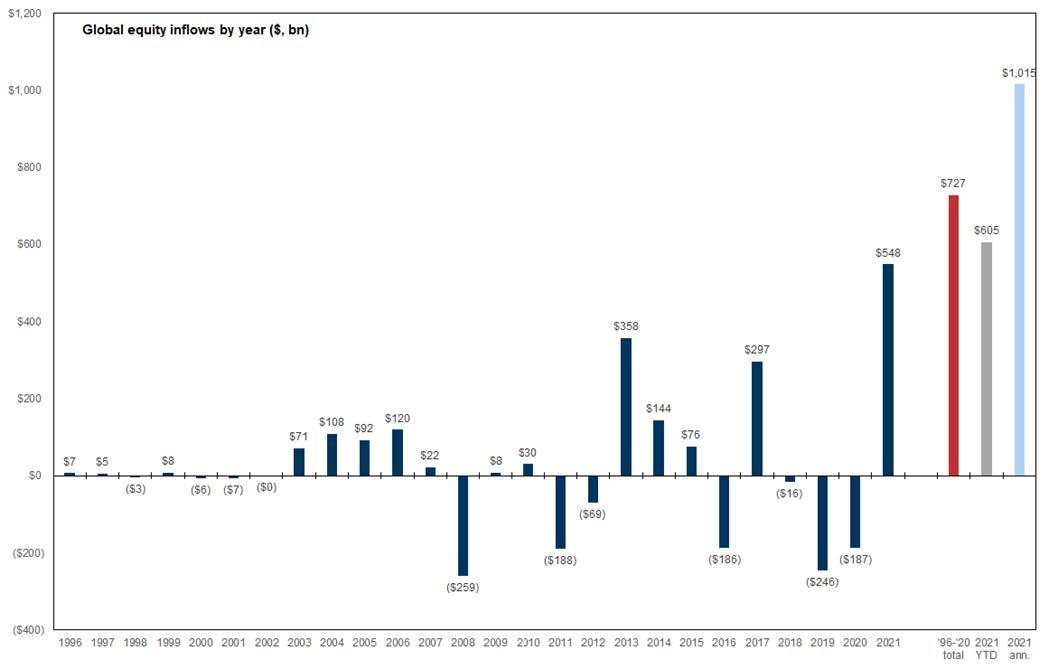
…and $852B in the last 41 weeks since positive vaccine developments.

2. Global Equities are annualizing +$1.015 Trillion worth of inflows for 2021. Does that sound like a lot? You bet.
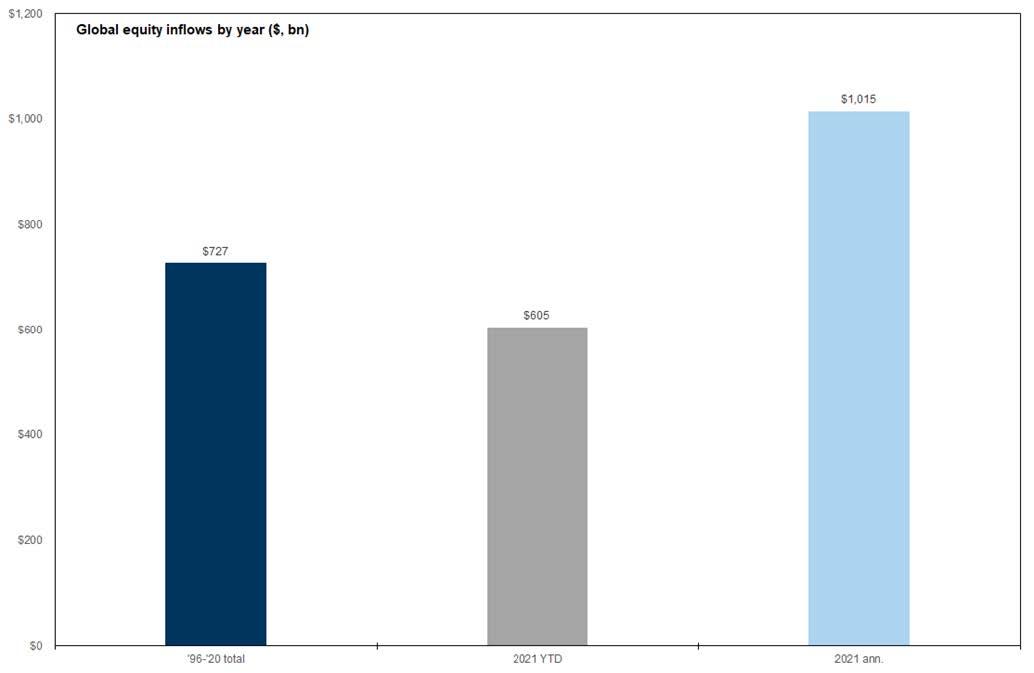
3. Global Equities logged +$727 Billion CUMMULATIVELY over the last 25 years. (from 1996 to 2020). This is when data providers started tracking flow data. (1999 was all single stocks, SPY was created in 1993).
4. The punchline: 2021 is on pace to record 40% higher than the prior 25 years of equity inflows combined!!
5. The average yearly inflow for the past 25 years is ~$29 Billion per year or +$115 Million per day.
6. YTD through week 31, 2021 is averaging (153 trading days) +$3.980 Billion per day.
7. Remember “outflows” and “demographics” have been the normal this cycle, the prior 3 years were outflow (2020 had -$187 Billion outflows, 2019 had -$246 Billion outflows, 2018 had -$16B outflows). i.e. there were sellers to normalize the move higher in equities.
8. 82% of YTD flows have gone into passive funds, while 18% of flows have gone into active funds.
9. Passive funds = “You give me $ and I buy”. You have not asked for money for me to sell. This is historically unusual.
10. There have been 47 new ATH’s YTD (on pace 76 on the year, best since 1995). [154 days / 47 ATH] = 1 new ATH per every 3.27 days.
* * *
Looking at the list above, Rubner writes that all else equal, this should move lower, and while he can debate the trigger, another question is when does this money make its way back to the stock market.

Rubner then notes there seems to be a wave of upcoming holidays and “there is now a 2-3 week window of a “pain trade higher” before clients start to trade around and hedge up FOMC risks, now nearing mid/end of September.” He summarize the key dates below, and notes that he likes Japan, non-Asia Emerging Markets, cyclical v. defensive pair for a quick move higher when “institutional clients come back from labor day” and more new ATHs post on CNBC.
- Jackson Hole (8/26-8/28) –now a non-event
- August NFP (9/3)
- Labor Day Holiday (9/6)
- Rosh Hashanah (9/6 – 9/8)
- August CPI (9/14)
- Yom Kippur (9/15 – 9/16)
- First official full week trading day of fall (9/20) * post summer and holidays
- FOMC (9/22) and “dot plot”
This brings us to the other main topic of the dog days of summer, namely that retail is back, and here are Rubner’s notes:
- S&P 500 has made 43 new all-time highs YTD. This is on pace for the best yearly record since 1995 (77 ATHs). This is one new all-time every 3.46 trading days in 2021.
- In the past 1-year, (8-5-20 / 8-5-21), there have been 63 new US equity ATH’s or 1 every 4.07 trading days.
- S&P 500 is up >17% through August. This has happened only 16 other times since 1928. The median return for the balance of the year is an additional +3.31%. This includes significant market events of 1929 (-25%) and 1987 (-24%), etc.
- To the US equity index construction committee, it’s been a perfect barbell. And the money tree is flowing. No outflows = No selloff.
- For the last 18 years, every Thursday night I pull in the weekly flow data. I could have not imagined ever typing in these large numbers. I check them twice every week, but they don’t change.
- There has been 187 US equity trading days from November 1st to today. This was the start of positive vaccine developments. Since November 2020, there have been +$837 Billion worth of global equity inflows in 40 weeks. This is +$21B worth of inflows every week or +$4.2B worth of buying per day.
- (Resending Passively Allocated) details below. These inflows are ALL USA, ALL PASSIVE, ALL LARGE CAP, ALL #BTD. “you ask for money = I buy”. Inflows continued this week. (Cash, Bonds, and Equities saw inflows this week, literally every field of my spreadsheet is positive).
- In addition, the WFH retail impulse of the market is starting to increase. The comments section of my r/wsb and twitter feeds started to pick up materially.
Rubner then summarizes the consensus feedback from investors during the first week of August:
- a) The biggest story in the market this week was the return of the retail trader.
- b) This is eerily similar to the set-up of August 2020, blow-off top and stock split days. Here are my note from this summer time last year. TFOF: Retail – August 2020
- c) the money flowed this week, and there was a competition for dip alpha. What does the consensus think about the consensus? d) The August bear camp is moving into September.
- e) “Is September the new August?” ~ given that Jackson Hole “event” moved into September FOMC.
- f) Yesterday was the first day of 2021 that I started to see “FOMU” kick-in (FOMU = fear of materially underperforming) adding right-tail hedges. Institutional flow has been selling (GS Sentiment indicator, GS PB ratios, shares volume, etc) vs. Retail YOLO buying (short dated calls)
Who was the biggest incremental buyer this week? RETAIL
This is not a full blown return of retail, but the retail impulse is increasing. The return of R/WallSteetBets (now 10.7M accounts) via “short dated call options” via VALUE + CYCLICAL + GO-OUTSIDE names again. Retail bought the Re-open dip. This is the first buying that we have seen in COVID fear epicenter stocks (trading apps, JETS, BETZ, Cruisers, Taxi’s, risk-arb shorts, etc). Let’s set the field on call options.
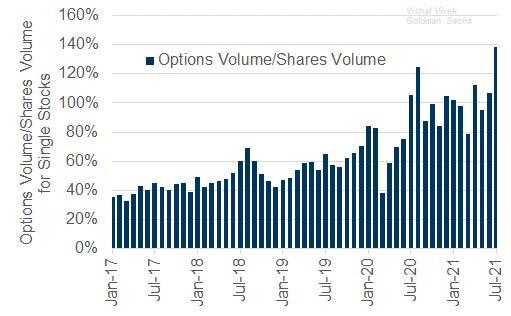
Institutional sentiment as measured by US shares notional is LOWER in August, while US option notional is at all-time highs!
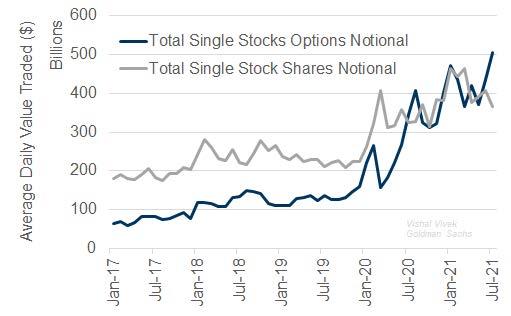
Option volume over shares volume is the highest level on record (>140%).
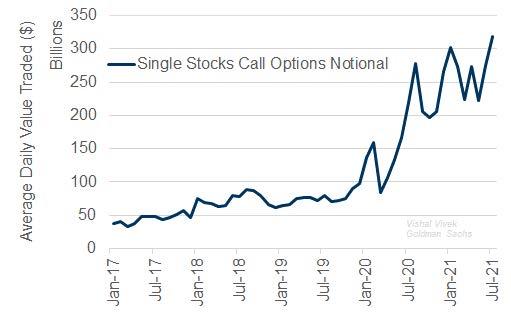
Single stock call notional is the highest level on record (~$320B) per day. There is no slowdown in calls.
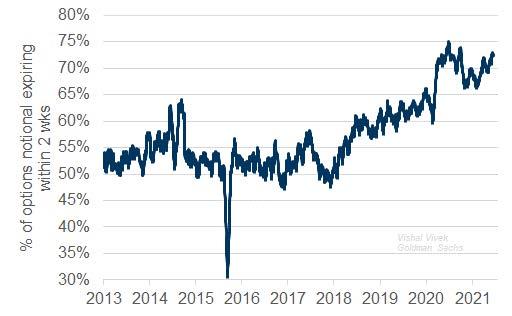
72% of options traded have an expiry of two-weeks or less, this is the shortest expiry on record.
Said another way, US shares volume – and institutional participation – is slowing into the summer, but the impact of delta hedges short dated YOLO calls has a greater impact, as retail just won’t stop BTFD, and if there is no dip, just B.
Tyler Durden
Sun, 08/15/2021 – 16:00
Continue reading at ZeroHedge.com, Click Here.