
Feature your business, services, products, events & news. Submit Website.
Breaking Top Featured Content:
Entering The Worst Seasonal Period Of The Year, And 10 Other Reasons Why Goldman Braces For An August Correction
In a stark reversal to its bullish sentiment at the start of the month, when the bank first noted – correctly – that the S&P was entering its best 2-week seasonal period of the year which it did between July 1 and 15 when it posted a series of new all time highs (before dumping on the 16th and the 19th)…
… followed by a lengthy rationalization why “the shorts will have to cover“, Goldman has been turning surprisingly bearish in recent days, and two days after Goldman flow trader John Flood urged Goldman clients “not to buy this dip” on Monday (spoiler alert: they did) his trading desk colleague Scott Rubner has published a report previewing why he anticipates a correction in the coming days and continuing through the Jackson Hole symposium at the end of August.
His note, from which we excerpt below, contains the key arguments behind Goldman’s August “correction” thesis, including tactical flow of funds, an acceleration of sellers, and feedback from the GS equity trading floor.
So without further ado, here is Rubner, who lays out his “11 point checklist for an August correction”, starting by noting that “the #1 question that has hit my inbox/IB in the past 48 hours. What happens to the equity market when there is an outflow and buy demand slows?” As we read below, the most appropriate answer is “nothing good.”
11 point Checklist – Consensus client feedback for a quick equity risk reduction into potentially lower buy demand into Jackson hole. The consensus feedback seems to be calling for a -5% correction, which really gets to -4%. This is a recap of the talking points about to hit your inbox this week. I think this morning’s rally gets faded as buy tickets are completed early in the day. “Selling rallies” is the new dynamic vs. buying dips.
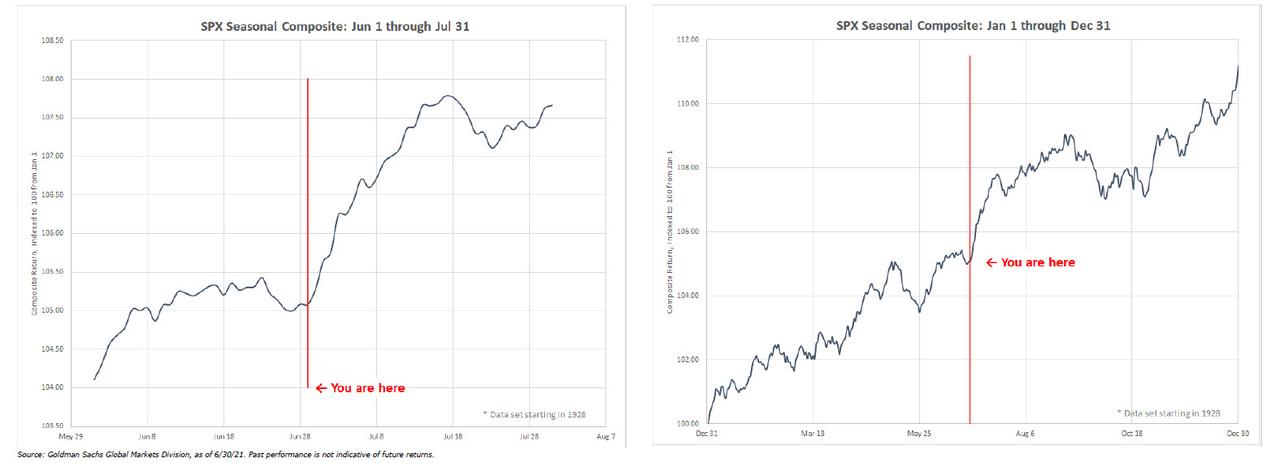
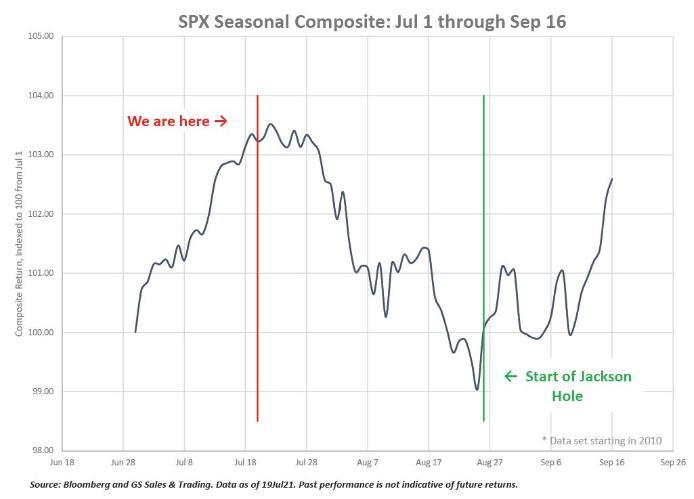
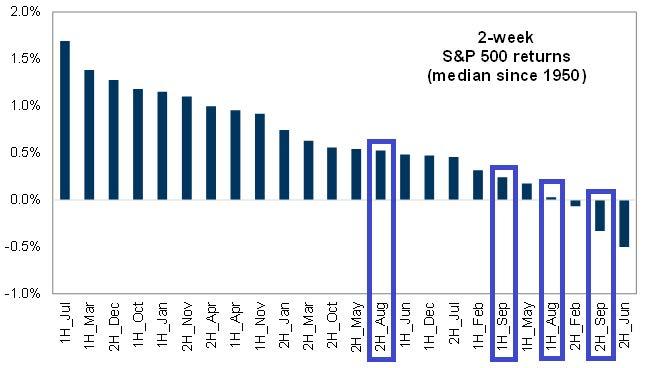
1. Weak Seasonals – Since 1928, we just exited the best two-week period of the year. Friday’s option expiry ended the best seasonal period of the year. August seasonals are not market friendly and trend lower all of August, for the 4th worst two-week seasonal period of the year. Today you are here and Jackson hole is the low point of this chart. Since 1950, there have been 19 times in 72 years that the S&P is up at least >10% through the first half of the year. The median return for August specifically, following a strong 1H is typically down -51bps, before rallying higher.
2. Largest outflows of the year – Investors allocate capital into the market in July and we have seen these record inflows. This is the biggest dynamic in the equity market this year period. Inflows continue at a record pace, annualizing at $1.2 trillion inflows for 2021. 401k inflows predominately flowed in S&P and NDX rather than ROW.
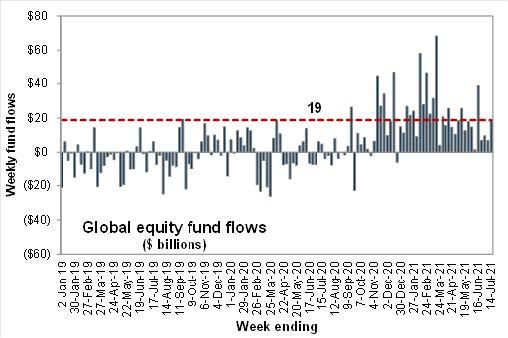
3. Reversal of flows predicted for August – Equity inflows are not common in August. Over the last 30 years, August typically sees the largest outflows of the year. -15bps of AUM typically leaves stock market funds in August, on ~22 Trillion, we model -$33B worth of equities for sale.
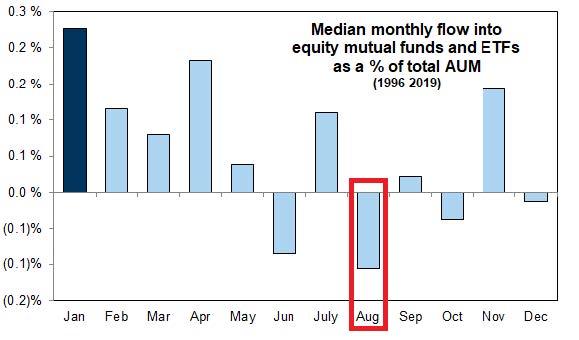
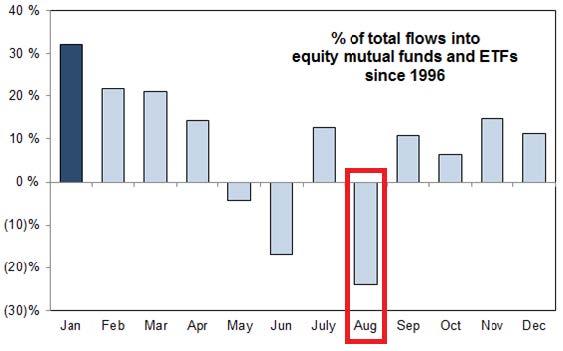
4. Outflows cont. To be clear, -$33B is not a significant $ figure when adjusted for market cap, however more important is that it’s not an inflow. The index level has remained at ATHs given inflows bid up the largest and biggest market cap index weights. On Monday we saw a large MOC imbalance for sale, this was unusual.

5. Passive flows drive largest marketcaps – Passive ETFs logged the best full year of inflows on record, in just the first half of the year. (+500b). I watch the tape every day register large MOC imbalances to buy at 3:50pm EST, but what if this dynamic fades. Remember $1 inflow into SPY flows $.23 cents into top 5 companies and $1 inflow into QQQ flows $.41 cents into top 5. If inflows flip to outflows you will no longer see broad index dynamic. Then investors need to decide which sector becomes the funding source for outflows.
Just how important has this been for the S&P 500? Important!
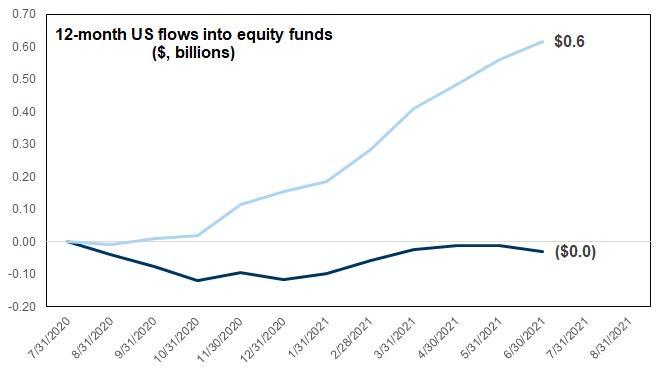
- Global Equity: 1-year: +$600B passive (IN) vs. $0.0B active (OUT) = >$600B.
- Global Equity: 5-year: +$2.30T passive (IN) vs. -$1.90T active (OUT) = >$4.2T
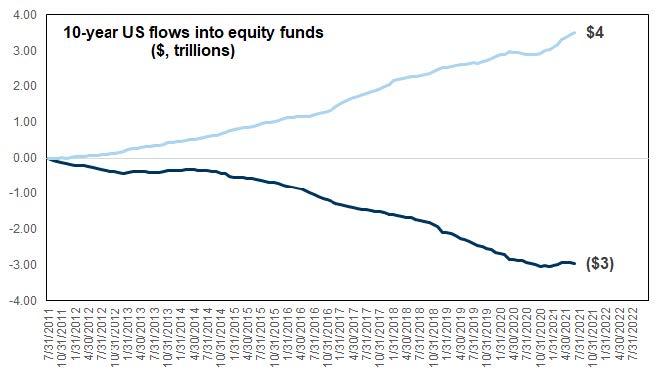
- Global Equity: 10-year: +$4T passive (IN) vs. -$3.0T active (OUT) = >$7.0T
- Current Global Equity Active AUM of $10.099T exceeds > Current Global Equity Passive AUM $7.225 T.

Side note: ETFs represented 36% of the notional executed volumes, last levels since in March/April 2020. (YTD average) = 24%. Did you see the massive volumes in SQQQ Monday (3x short QQQ)?
6. Single Stock Calls – This is set up is very similar to July and August 2020 blow-off top as a result of call option trading. Reminder, S&P sold off -392bps in September 2020 after call option volumes started to fade.
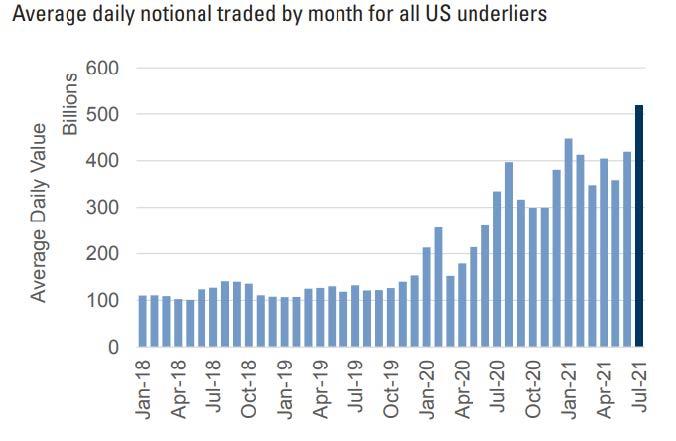
- Option notional has averaged an all-time record of +$550B per day in July. The top 3 traded stocks (AAPL, AMZN, and TSLA) make up $300B of daily volumes. Breadth in both options and stocks is low.
- “Of 4000 Tradeable Single Stock options, the top 3 names make up 56% of the daily avg notional traded. Adding in the next 7, that ratio jumps to 72%.”
- “Said another way the top 10 underliers trade 3x more notional on an average day than the bottom 3990”
- This is an important dynamic to monitor.
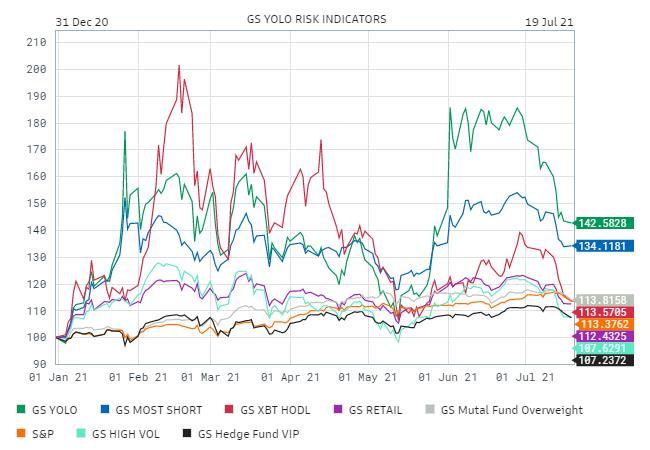
7. Call Options cont. – Retail has pivoted from trading weekly call options on GME and AMC – only $6B combined notional per day to the stay-at-home playbook. The names with the highest daily option trading are also the largest index weights. In addition to ETF flows, the retail call option buying frenzy also takes the street short weekly gamma on single names. 75% of single stock options traded today have an expiry of two weeks or less. Said another way, given GS YOLO risk sentiment basket has rolled over, does AAPL need to catch down next (or at least not see YOLO flows).
$181bln/day AMZN
$ 82bln/day TSLA
$ 36bln/day AAPL
————–
TOTAL TSLA/AMZN/AAPL: $299bln/day ——- What happens if call volume in mega cap tech declines?
$ 26bln/day NVDA
$ 14bln/day GOOGL
$ 11bln/day FB
$ 10bln/day MSFT
$ 8bln/day SHOP
$ 8bln/day GOOG
$ 8bln/day NFLX
$ 7bln/day BABA
————–
TOTAL GOOG/GOOGL/MSFT/FB/NFLX/NVDA/SHOP/BABA: $90bln/day
$ 4bln/day AMC
$ 2bln/day GME
————–
TOTAL AMC/GME: $6bln/day ——- No Mo’ Yolo? See chart below.
All other underlyings: $141bln/day
Total single stock option market:
$299bln/day TSLA/AMZN/AAPL
$ 90bln/day GOOG/GOOGL/MSFT/FB/NFLX/NVDA/SHOP/BABA
$ 6bln/day AMC/GME
$141bln/day All other underlyings
——————–
$537bln/day Total
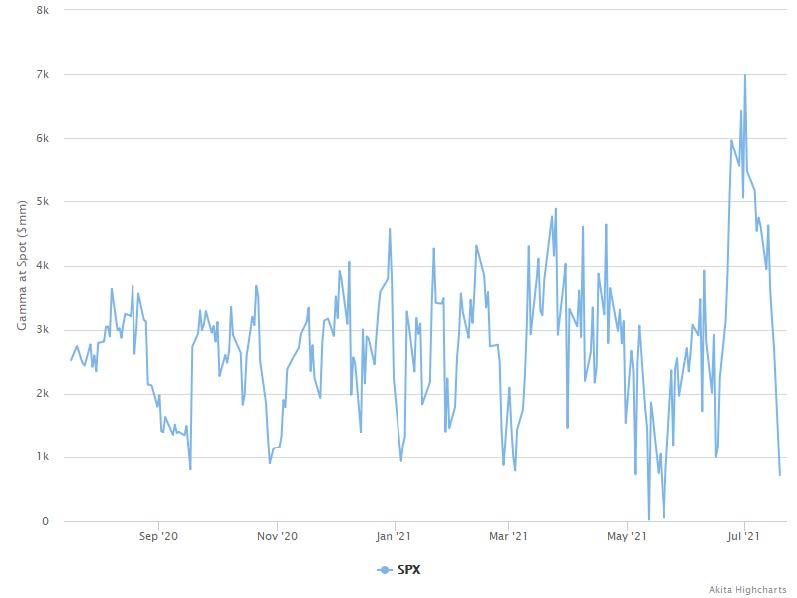
8. Option Gamma Unwinds – Option Expiry just rolled off -85% of the market long gamma. The market now has the ability to move more freely and trade less long gamma. Everyday last week the market would rally into the bell as dealers re-hedge their gamma (buying the dips). I get worried about summer end-of-day liquidity without gamma hedging and passive demand. I think there will be also a “institutional” demand to buy hedges into Jackson Hole fulling removing the long gamma taking the street short to hedge downside. We have seen more puts and put spreads on the desk this week than any week of 2021.
- Wednesday (7/14) SPX gamma = +$4,625B
- Thursday (7/15) SPX gamma = +$3,620B
- Friday (7/16) SPX gamma = +$3,136B
- Monday (7/19) SPX gamma = +$2,698B
- Tuesday (7/20) SPX Gamma = +$713B.
the Long S&P 500 gamma has been reduced by -85% in the past 5 days taking dealers less long gamma. This dynamic changes market behavior and we are seeing little demand to systematically overwrite from here even despite the move higher in vols. This is new.
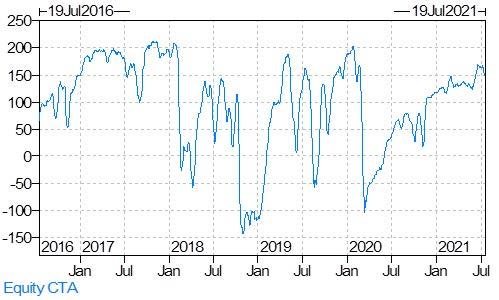
9. Systematic – Non-economic is already near the max exposure and have little scope to add further from here. No threshold levels have triggered so far, but it is important to note the lack of ability to add from here, which asymmetrically skews the downside.
- CTA – 90% percentile on 1-year rank, 84% percentile on 3-yr rank.
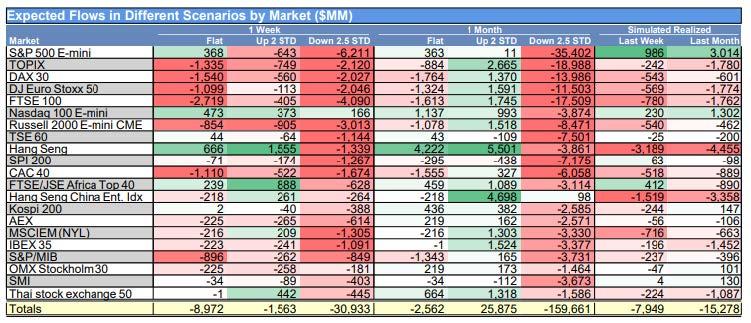
- GS models -$9B of equities for sale over the next week. CTA’s are sellers in an up tape, down tape, down big tape. That’s not common. Check out big asymmetry to the downside over the next 1 month.
- GS short term CTA ES1 Flip Level = $4,257.90. We tripped this circuit breaker yesterday, but are higher this am. I expect GS sell expectations to increase.
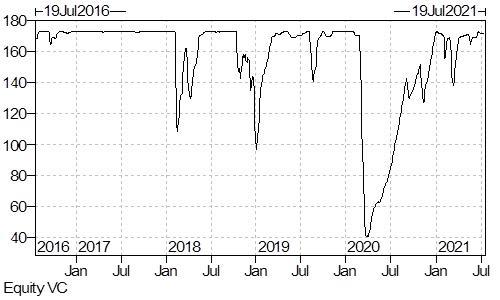
b) Vol Control – 86% percentile on 1-year rank, 75% percentile on 3-yr rank. FYI. SPX Put/Call Ratio hit a fresh 1 year high yesterday.
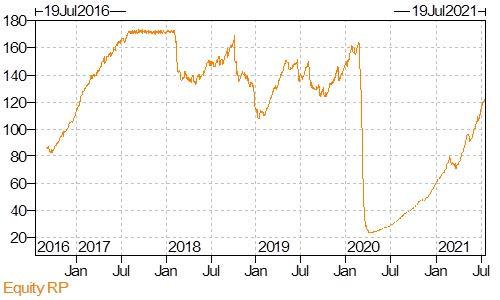
c) Risk Parity – 100% percentile on 1-year rank, 53% percentile on 3-yr rank.
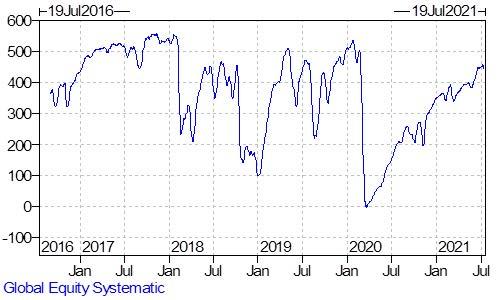
d) Total Systematic – 92% percentile on 1-year rank, 80% percentile on 3-yr rank. This is important. This non-emotional demand is at the max and will be sellers lower.
10. Liquidity – The unofficial Rubner out of office outlook (OOO) reply meter. My note last week has week had the largest out of office kickbacks to the tune of “see you in a few weeks” or “gone fishing”. The upcoming calendar into Jackson Hole is important.
- next few weeks, extended vacation schedule first time in 12 months, etc, moved forward because Jackson hole.
- Jackson Hole, August 26 (Thursday) – August 28 (Saturday) – Friday is the likely the key calendar, but potentially Saturday will be important. This moves hedges to the following week.
- Labor Day, September 6 (Monday exchange holiday) – late this year
- approximate First day of Children’s school, September 7 (Tuesday)
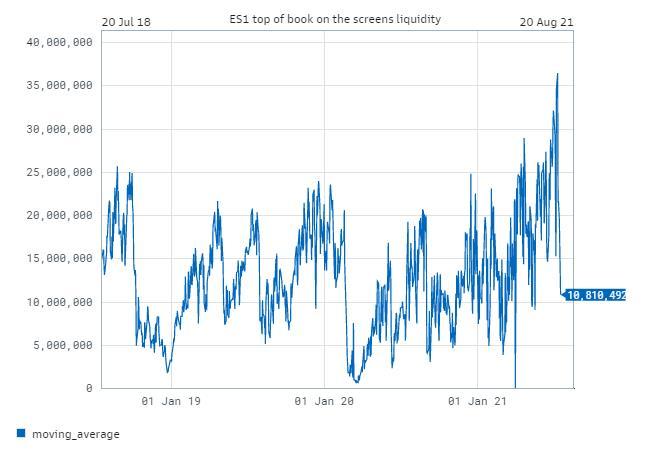
- Liquidity = August Summer – ZZZZ. Top book liquidity declined SUBSTANTIALLY into the sell off yesterday.
*** despite being ranked 10 in the checklist. This is really chart #1. Liquidity dried up substantially yesterday on the screens. This chart peaked at $36M last Monday to $10.810M yesterday. This is a drop of $25M $ or ~70% in on screws liquidity in 1 week.
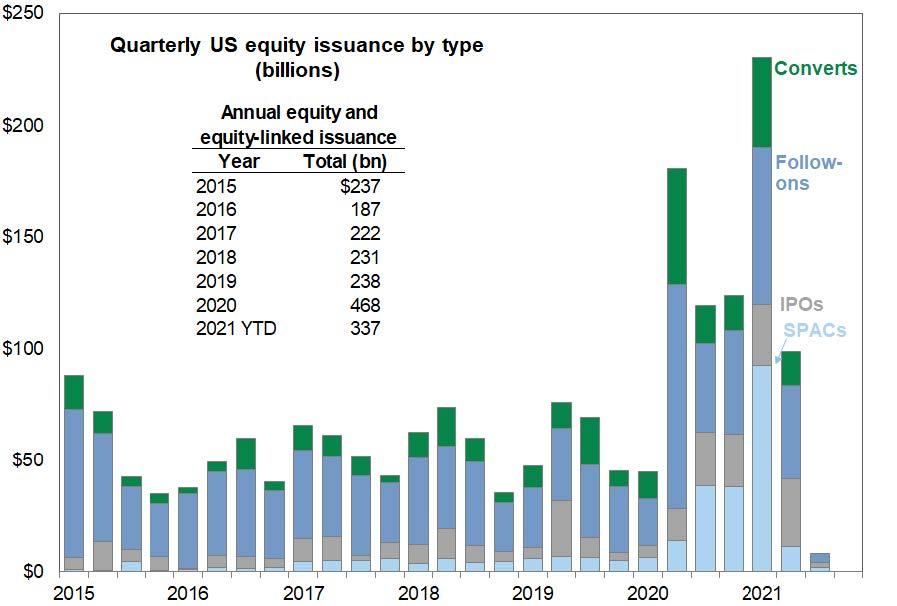
11. Buybacks: Buybacks are here, but so is equity issuance, which neutralizes the buyback impulse. As corporates meet corporates. From Sales and trading colleague, John Flood in his most recent trading note.
“It has been a paper party and this paper is getting harder to place. Last week we priced 11 registered deals in the U.S. ($3b notional) and this week already working on another 18 ($10b). This is especially noteworthy while in the depths of July.“
- Last week there was $6.2 billion in equity issuance, compared with the July weekly average of $3.4 billion since 2000.
- Last week there were 27 equity deals brought to market, compared with the July average of 15 deals per week since 2000.
Bottom Line: Keep Tactical Flow of Funds Checklist on your radar for August. The technical market structure dynamics changes substantially during August. I think there will be a dip (-5%) and it is meant to be bought heading late into Jackson Hole. The consensus is calling for a larger equity market correction, I do not see it given the amount of capital in the system. I change my tone if we trigger key levels to the downside as sellers are lower. If August outflows actually happen, I think tech underperforms cyclical value reopen given high concentration and largest passive impact. Once we see the first outflow in August, this will be the macro trigger for a tactical short. Stay tuned and keep an eye on liquidity.
Tyler Durden
Wed, 07/21/2021 – 16:20
Continue reading at ZeroHedge.com, Click Here.