
Feature your business, services, products, events & news. Submit Website.
Breaking Top Featured Content:
“Record Market Fragility”: Something Snapped In Q1… And What Goldman Expects For Q2
As Goldman trader and head of HF sales Tony Pasquariello writes in his first quarter post-mortem, “Q1 is done. boring, it was not.“
And, boy, can say that again… but before we get into the weeds of what happened (and what may happen) let’s first take a look at the obvious – the best and worst performing assets of the past quarter.
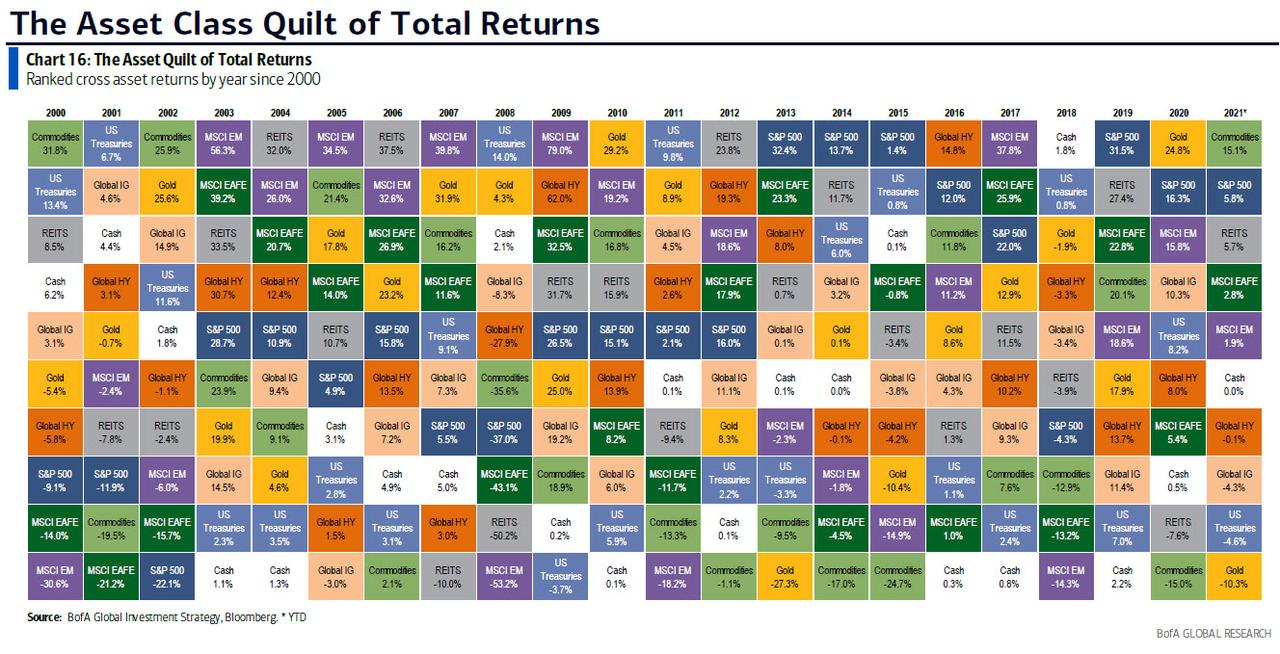
Luckily, Deutsche Bank has done the analysis, and in a note from the bank’s strategist Henry Allen, he writes that markets had a pretty mixed performance in Q1, with 20 of the 38 non-currency assets in the German bank’s sample having a positive return over the first three months of the year. The gains concentrated among risk assets including equities, oil and HY credit, as progress on the vaccine rollout and the prospect of further stimulus in the US proved supportive. In a reversal of 2020 however, safe havens have struggled against this backdrop, with gold the worst-performing asset in the main sample (bitcoin was on the other end) and sovereign bonds also losing ground over the quarter.
A quick detour here from BofA CIO Michael Hartnett, gives us the highlights in the form of the following performance: Bitcoin 103.3%, oil 21.9%, global stocks 4.7%, US$ 3.7%, cash 0.0%, HY bonds -0.1%, IG bonds -4.3%, government bonds -5.8%, gold -9.6% YTD.
Going back to DB, we are reminder that one of the biggest stories over Q1 has been the massive rise in US Treasury yields. This began at the very start of the year as the results of the Georgia Senate runoffs meant that the Democrats would have control of both houses of Congress under the new Biden administration. In turn, this has given them the leeway to pursue substantial stimulus, with the $1.9tn American Rescue Plan already signed into law, and Biden announcing his American Jobs Plan yesterday. In response, yields on 10yr Treasuries have risen by +82.7bps over the quarter, which is the largest rise in absolute terms since Q4 2016 when Donald Trump unexpectedly won the presidency.
However, the selloff in sovereign bonds hasn’t been confined to the US, with their European counterparts also losing ground as investors increasingly bet on a stronger economic recovery once the vaccine is rolled out. Gilts (-7.3%), bunds (- 2.4%) and BTPs (-0.9%) all fell over the quarter, though their monthly performance for March hasn’t been quite as bad, with only bunds losing ground slightly.
On the other end, for equities, both March and Q1 marked a very strong performance, and in a major reversal from 2020, it was European indices which saw the largest advances. Over Q1, the DAX (+9.4%), the FTSE MIB (+11.3%) and the STOXX 600 (+8.4%) all saw solid gains in total return terms, while banks led the way thanks to higher yields, with the STOXX 600 Banks up +20.3% over the quarter. The US lagged behind however, with the S&P 500 up +6.2%, albeit rising to fresh highs in March, while EM indices were even further back, with the MSCI EM Equities up just +2.2% over the last three months.
Of course, nothing compares to bitcoin, which has exactly doubled since the start of the year…
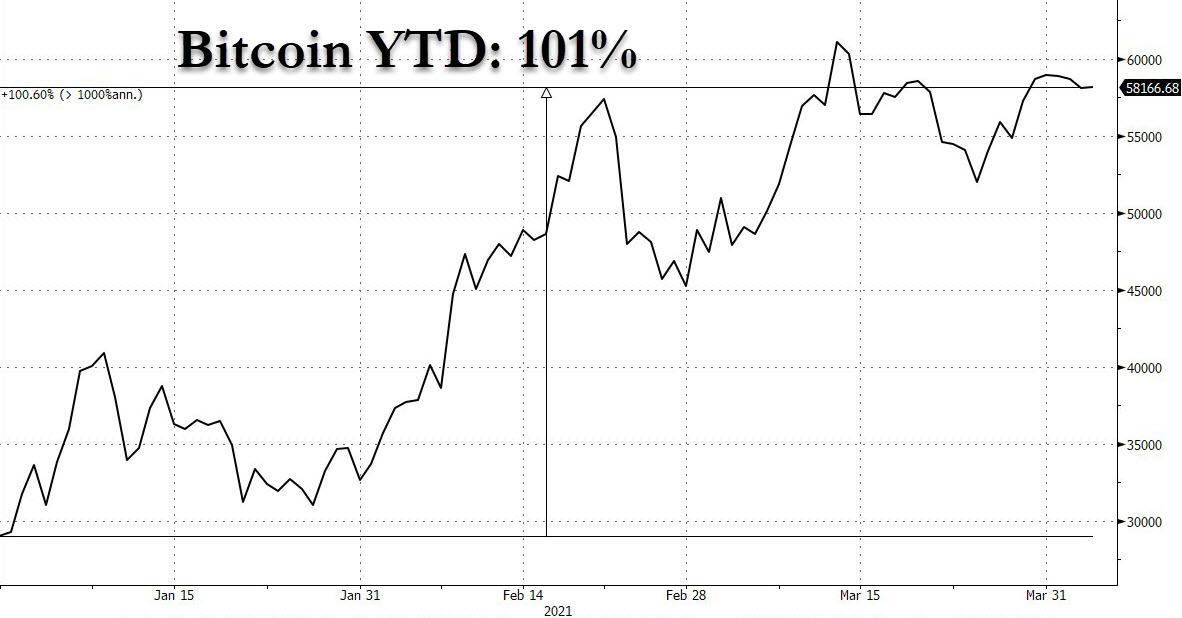
… but away from crypto, the top performing asset continues to be oil on a YTD basis, with a Q1 performance of +22.7% for Brent Crude and +21.9% for WTI. Oil is still in the lead in spite of the fact that both prices fell over the last month, as concerns over a rise in Covid cases at the global level led to renewed fears about further restrictions and reductions in mobility. Nevertheless, while oil is at the top of the DB YTD sample, other commodities haven’t performed so well, with precious metals the worst, in a mirror image of returns last year.

Bottom line, going back to Pasquariello, he puts it best saying that “on the surface, it was a fine quarter: S&P printed a 6.2% total return on 7.8% realized volatility, and sits within close reach of both the highs and the 4000 level.” However, as the Goldman trader expands, “those headlines, belie the degree of difficulty involved in managing professional money along the path — particularly within the fundamental long/short space.”
To illustrate the turbulence below the surface, consider the following Q1 returns:
- the hedge fund VIP basket (GSTHHVIP) underperformed a basket of widely held shorts (GSCBMSAL) by … 30%
- growth stocks (GSXUMFGL) underperformed value stocks (GSXUMFVL) by … 28%.
- 52-week momentum winners (GSCBHMOM) underperformed 52-week momentum losers (GSCBLMOM) by … 18%.
In working through the presumed drivers of these factor breaks, the Goldman trader points out the following key items:
- be it the 82bps backup in US 10-year note yields — or the worst start to a year in the history of the aggregate index — the bond market sold off hard, with that came an element of climate change for stock operators.
- on one hand, Q1 saw the largest inflows to equity funds on record; on the other hand, as the quarter progressed, some steam came out of the higher velocity vehicles (witness a clear decline in single stock call option volumes, recent outflows from ARKK, and some indigestion in certain corners of the new issue market). ZH discussed this one month ago in “Another Market Paradox: Wall Street Struggles To Explain Record Equity Inflows Amid Stock Turmoil“
- on the fundamental side, the fiscal story in Q1 was eye-popping; a $900bn rush in December was followed by a $1.84bn boomer in March. All of that was deficit financed. Meanwhile, as we learned last week, the next round – perhaps the final round – will be much more complicated with respect to funding and taxes.
If all that is a little abstract for some, here is BofA’s CIO Michael Hartnett breaking down Q1 i) by the numbers; ii) by winners and losers and iii) by flows:
Q1 by the Numbers:
- 608MM global Covid-19 vaccinations,
- More than $4tn US fiscal stimulus,
- 200bps jump in US ’21 nominal GDP forecast to >8%,
- global stocks +$5tn in market cap,
- Value of negative-yielding global bonds drops $6tn,
- Worst Q1 return for 30-year Treasury since 1919,
- Worst Q1 for IG bonds since 1980,
- Worst Q1 for gold since 1982.
Q1 Winners & Losers:
- winners = cyclical stocks…energy stocks 29%, oil 22%, banks 23%, copper 13%;
- losers = bonds & duration…30yr UST -16%, gold -10%, EM LC bonds -8%, US IG bonds -6%, US biotech -4%;
- tighter financial conditions led to “events”, e.g. GME, Archegos…, but stocks (XHB +22%, XBD +16%) signal “good” rise in rates thus far.
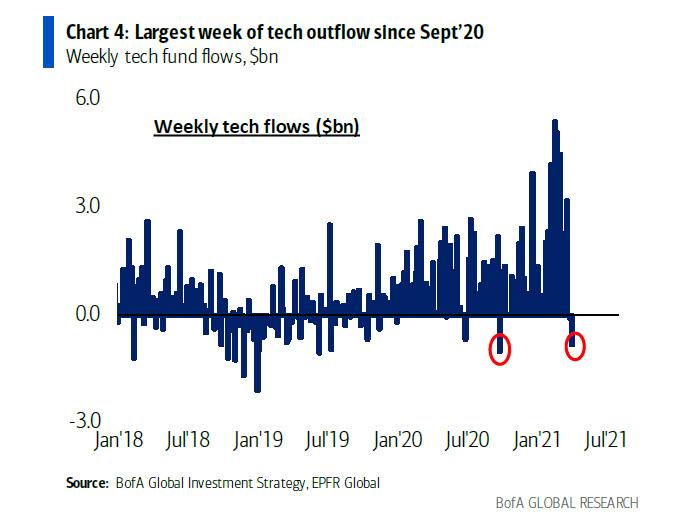
Q1 flows: record inflow to global equity ($372bn), EM ($65bn), value ($35bn), tech ($30bn), financials ($24bn); largest equity inflow % AUM (2.4% – Chart 3) in 15 years…

… although this appears to be reversing with the biggest tech outflows since Sept 2020:
Indeed, while superficially the broader markets rose, there was a tangible bifurcation within risk assets with catastrophic results for some traders.
Which brings us to the latest note from BofA derivatives strategist Benjamin Bowler, who in a note published last week, reverts to his favorite theme, namely that growing market fragility has made risk-taking extremely risky, despite the overall rise in markets.
As Bowler puts it, in words that could threaten to “cancel” him for being overly honest, “markets are fragile owing to extreme liquidity driving asset bubbles and trading liquidity drying up at record speed during times of stress.” He then adds that “while an increasing number of people intuitively accept this fact, modelling this risk can be difficult, and underappreciating the nature of fragility can make risk-managing levered positions challenging. In part, this is because traditional volatility metrics woefully understate today’s still high PNL volatility among US stocks.”
What does Bowler mean by this? Well, consider that as shown in the chart below, so far in 2021, the total market cap being gained or lost in extreme swings among S&P 500 stocks is nearly on par with that of the first half of 2020 (during the Covid crash), despite stock volatility being over 40% lower now.
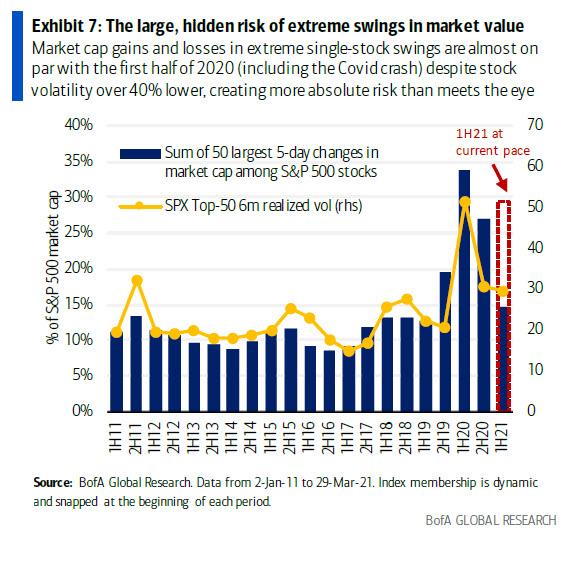
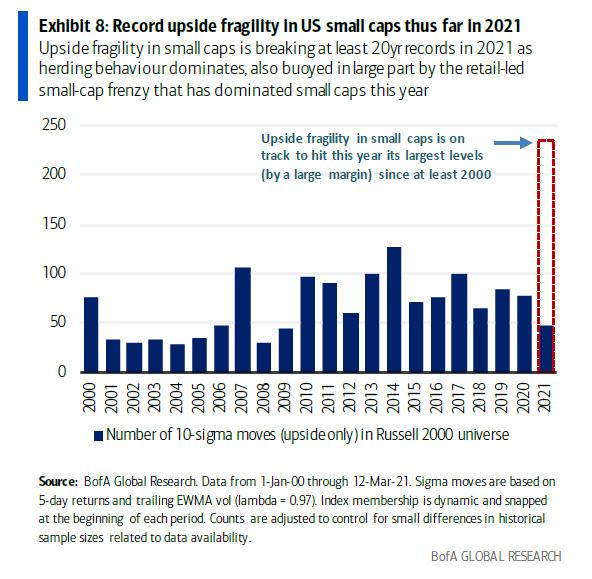
Notably, there were unprecedented, extreme swings among small cap stocks, which in Q1 set records with 80% more 10-sigma upside shocks this year than ever before according to BofA, which to Bowler illustrates that “there is more risk to managing risk than meets the eye.”
In other words, something clearly snapped in the market’s “reaction function” to a quarter that saw a gargantuan fiscal stimulus injected into the economy to make the already massive monetary stimulus.
This, in turn, takes us back to the conclusion from Goldman’s Pasquariello, who summarizes his market sentiment as follows:
certain impulses changed as the quarter wore on, which presents a different setup for Q2. to be clear, if April and May are THE peak growth months for US economic activity — perhaps as robust as anything we’ll see in the remainder of our careers, — there’s still a lot to play for.
It perhaps not surprising then that looking ahead, one of Goldman’s top traders believes that “a reflationary framework is the right place to anchor your risk-taking” although there are a few key caveats:
I’m trying to balance that anchor point against an instinct that liquidity dynamics – and the trading environment – are changing. If that’s all mostly correct, the path higher from here is apt to be choppier and risk/reward is not what it was four or five months ago. in practical terms, this argues for a more tactical trading stance where illiquid positions – and recency bias – are the enemy.
That said, in his final point, Pasquariello writes that if he is wrong on the view that risk/reward is a bit more balanced now, he thinks it will be on the right tail. as the US quickly moves towards herd immunity. In other words, he expects a blow off top in risk assets, due to the following three data points:
- i. $4.44tr currently sits in US money market funds ($1.5tr is held by retail, $2.94tr is held by institutions). since February of 2020, that $4.44tr pile has grown by … $830bn.
- ii. US households have accumulated about $1.5tn in ‘excess’ or ‘forced’ savings, and Goldman expects that to rise to about $2.4tn, or 11% of GDP, by the time that normal economic life is restored around mid-year
- iii. attendant to the largest jump in US consumer confidence in 18 years: a record share of respondents said they plan to purchase a home in the coming months. a measure of consumers’ plans to buy cars and major appliances also rose. a separate report Tuesday showed U.S. home prices surged to the highest since February 2006.
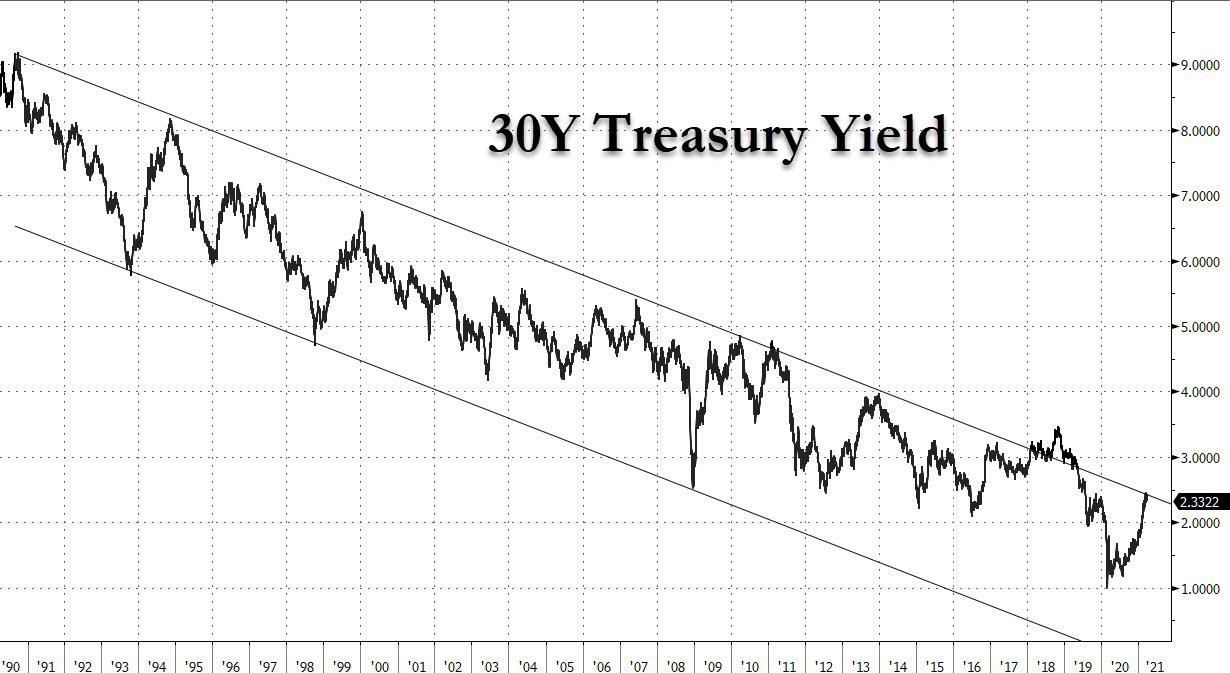
Pasquariello then shares several “must see” charts (profiled earlier), which also includes the long-term chart of the 30Y TSY, which to the Goldman trader is “the most interesting chart on planet earth right now.”
Read the full post here.
Tyler Durden
Sun, 04/04/2021 – 15:30
Continue reading at ZeroHedge.com, Click Here.