
Feature your business, services, products, events & news. Submit Website.
Breaking Top Featured Content:
Goldman Prime: Thursday Saw A Flood Of Short Selling
It had already been a painful decade for short sellers, who as a result of Fed market manipulation and support had no choice but to take their short interest to the lowest in history (and certainly since the dot com bubble)…
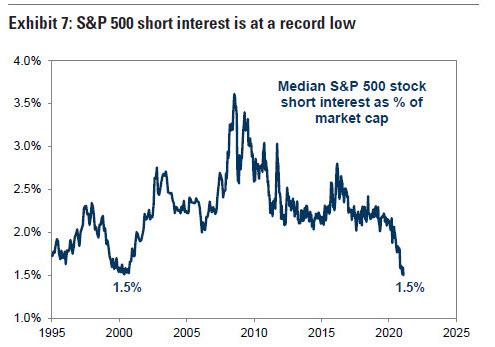
… when the pain level hit unprecedented levels in late January when coordinated bull raids inspired by Reddit threads targeting heavily shorted stocks such as GME and AMC, crippled what was left of the short-selling community.
Yet while one would imagine that what few shorters were left will have learned their lesson to never fight the Fed…. and in this case also Congress, which is about to inject over a trillion in “stimmy” checks…

… one would be wrong because according to the latest data from Goldman Prime, the marry short selling men have reemerged after the latest mauling, and Thursday’s market saw the most aggressive shorting inf months.
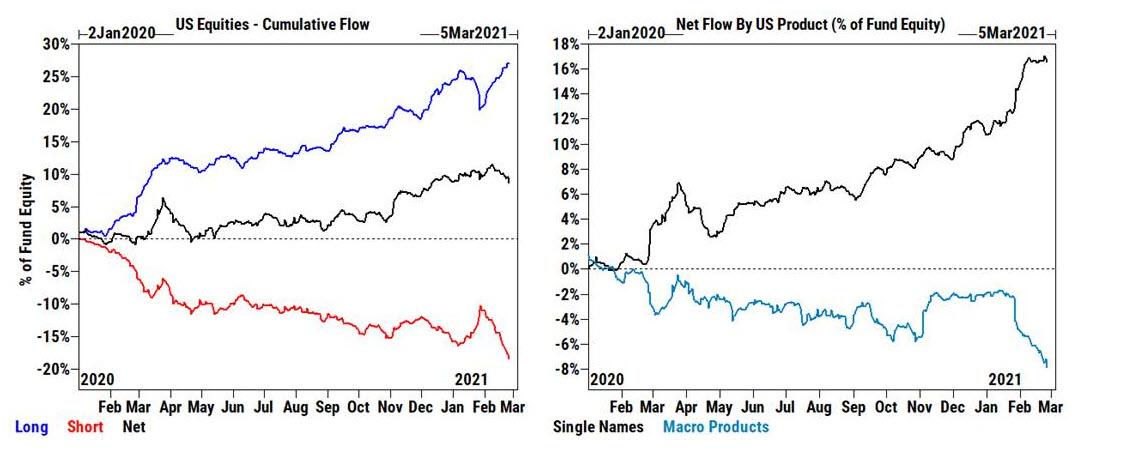
As Goldman’s Vincent Lin writes, the GS Prime book was net sold on Thursday (-1.6 SDs vs. the average daily net flow of the past year), driven entirely by short sales which far outpaced modest long buys (13 to 1), with the trading elaborating that net selling was concentrated in North America from a regional standpoint, which outweighed net buying in EM Asia (long buys + short covers) and Asia (long buys), while European equities saw little net activity.
Some more details:
- US equities – Largest net selling since Jan 27th (-2.2 SDs), driven by short sales in Macro Products and long-and-short sales in Single Names
- Macro Products (Index and ETF combined) and Single Names made up approx. 70% and 30% of Thursday’s $ net selling, respectively.
- ETF shorts on the Prime book increased +2.4% (+6.3% week/week, +26.1% YTD), driven by Corporate Bond, Technology, and Large Cap ETFs.
- ETFs made up 31% of the US volume (+40% vs YTD average), the highest % of the tape since early November.
Away from ETFs, single names were net sold for a second straight day and saw the largest $ net selling since Jan 25th, with shorting concentrated in Info Tech and Consumer Discretionary stocks; of these, Info Tech saw the largest $ net selling since Jan 26th ( -1.4 SDs), driven by long-and-short sales (5 to 1); Consumer Discretionary were net sold for a fifth straight day (-1.6 SDs), driven mainly by long sales. The net selling continued even after Feb 24th when Consumer Discretionary stocks saw the largest net selling in more than five years.
On the other hand, Health Care (long buys > short sales), Financials (long buys > short sales), Industrials (short covers > long sales), and Materials (long buys + short covers) were all net bought on Thursday.
Curiously, within tech a familiar group appears to have avoided the shorting fury for now: in contrast to the large net selling in Info Tech and Consumer Disc stocks, the TMT Mega Caps (FAAMG) saw the largest $ net buying since Feb 5th (+0.4 SDs), driven by long buys and to a lesser extent short covers.
Here is a breakdown of Thursday’s action by industry:
- Most net bought industries – Capital Markets, Chemicals, Biotech, Airlines, Professional Services, Wireless Telecomm Svcs, Hotels, Restaurants & Leisure, Aerospace & Defense
- Most net sold industries – IT Services, Internet & Direct Marketing Retail, Interactive Media & Svcs, Semis & Semi Equip, Automobiles, Media, Metals & Mining, Specialty Retail
Next, here is Goldman’s estimate of performance: Thursday was the worst day for Fundamental LS performance since Jan 27th but LS returns remained positive MTD
Thursday (2/25)
- Fundamental LS -1.4% (alpha -0.6%) vs MSCI TR -1.5%
- Systematic LS +0.4% (alpha flat)
February MTD
- Fundamental LS +5.4% (alpha +1.2%) vs MSCI TR +3.8%
- Systematic LS +2.0% (alpha +2.0%)
2021 YTD
- Fundamental LS -0.5% (alpha -5.4%) vs MSCI TR +2.8%
- Systematic LS +3.0% (alpha +3.4%)

Finally, clearly it has been a dismal YTS – ad LTM – for fundamental hedge funds, and according to Goldman the fundamental Long/Short ratio fell the most since Jan 27th and declined for a 7th straight day; now in the 75th percentile vs. the past year

This brings us to one final point: much of the late January fireworks erupted because a bunch of retail daytrading sleuths discovered the few pockets of short-selling resistance and launched repeated bull raids forcing these hedge funds to cover. Now that bearish hedge funds are tentatively dipping their toes and reshorting, how long before the next massive squeeze rips stocks – especially the junkiest of names – higher again?
Tyler Durden
Sun, 02/28/2021 – 15:20
Continue reading at ZeroHedge.com, Click Here.