
Feature your business, services, products, events & news. Submit Website.
Breaking Top Featured Content:
Inflation Here, There, And Everywhere
Authored by Bryce Coward via Knowledge Leaders Capital blog,
What a week for price data! We have been writing about the possibility of higher inflation for months now, most recently here. We have also highlighted the most likely assets to benefit from higher inflation like copper, oil and energy stocks. So far so good on that front.
While inflation of some kind – be it transitory or more lasting in duration – has been a high probability scenario for awhile, we are finally starting to see it clearly in the economic stats. This week alone we were given price data from the New York Fed’s Empire State survey, economy-wide producer price data from the Bureau of Labor Stats, and price data from the Markit PMIs. All of those data points recorded large gains and handily beat market expectations.
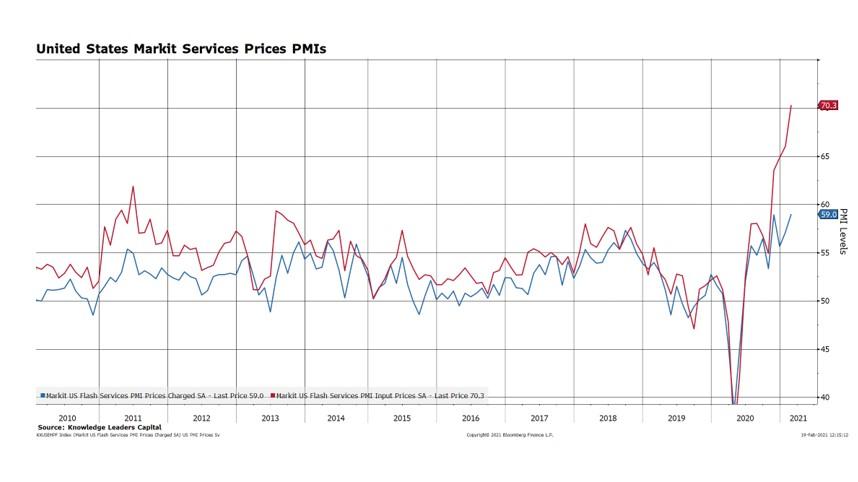
For example, the Markit Services Input Price series went parabolic in February, recording the highest reading ever, by a long shot. The Output Price series also went up, but not as much as input prices. The difference between input prices and outprices implies margin contraction for services companies. We wouldn’t expect this level of margin compression to be sustained and thus expect output prices for services to rise handily in the months ahead, especially as covid vaccinations continue to chug along and reopening continues.
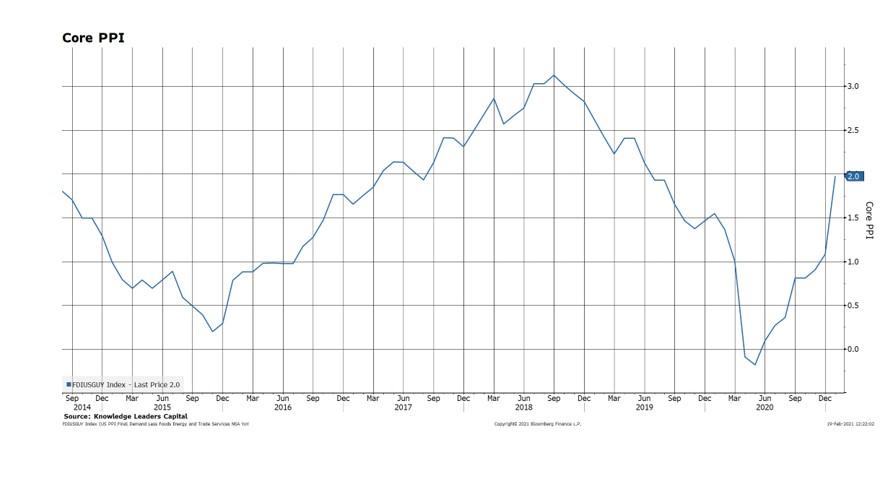
Producer prices rose significantly in January too. Core producer prices (prices ex food, energy, and trade), recorded a 2% year-over-year gain, which was fully double the “Street’s” estimates.
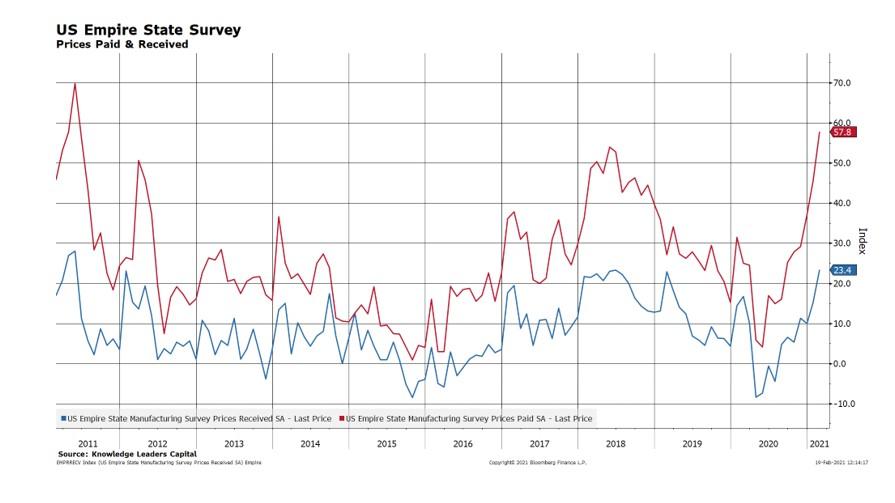
Finally, the Empire State manufacturing survey recorded a 10-year high in Prices Paid and a 9-year high in Prices Received.
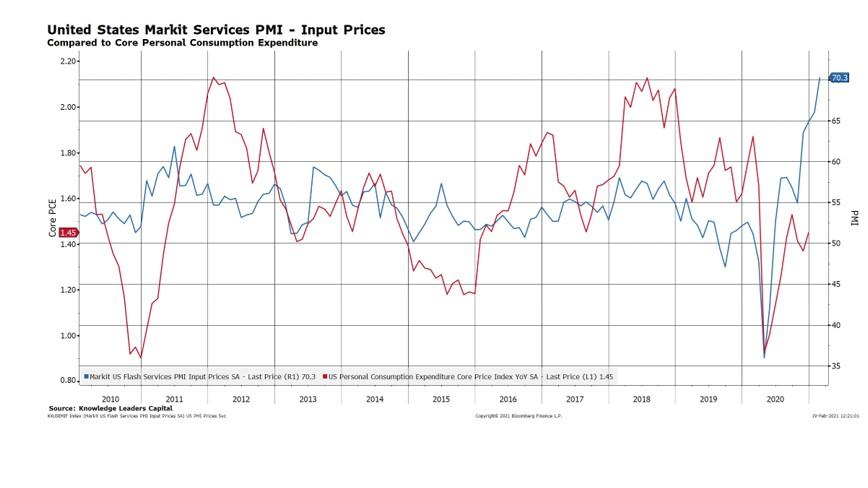
With these data all moving in one direction (up), it’s only a matter of time before the Fed’s preferred measure of inflation – the core personal consumption expenditure (PCE) – catches up. The PCE is often the last inflation statistic to move, but movement in the upward direction is pretty much baked in the cake at this point.
If history is a guide, the level of service company input prices (blue line) suggests we could see a core PCE reading above 2% within the next two months.
Why does all this matter? Inflation impacts asset prices directly through the level of bond yields and indirectly through the increased volatility it brings to sales and earnings. The longer duration the asset, the more impact on that asset’s price as a result of inflation. For example, 30Y year Treasury yields (duration 20 years) are up nearly 40bps since the beginning of the year while 10 year Treasury yields (7 year duration) are only up 25bps. The Nasdaq 100 index (the longest duration major equity index) is up only 5% YTD compared to the Russell 2000 (a much shorter duration index), which is up 14.7%. Copper miners, which are among the shortest duration equities, are up 28%. To the extent the inflation data continues to come in hot, we would expect the above hierarchy of asset price returns to hold, generally speaking.
Tyler Durden
Sat, 02/20/2021 – 15:30
Continue reading at ZeroHedge.com, Click Here.